

Nifty 50 Weekly Analysis: At a Critical Technical Crossroads
What Happened This Week?
The Nifty 50 ended the week at 24,366, down around 0.83% for the week, as the index struggled to sustain momentum after moving back toward the upper end of its recent consolidation range.
The broader technical picture remains mixed rather than decisively bearish. On the one hand, the index continues to trade within the broader monthly mother-candle range, while the weekly chart shows price sitting almost exactly around the 50-week EMA at 24,363.35. On the other hand, the daily chart shows the index holding above important medium-term support levels, including the 200-day EMA at 24,408.05 and a rising trendline from the recent low.
This creates an important technical setup for the coming week.
The immediate question is whether Nifty can regain momentum and move higher from these support zones, or whether another rejection will push the index toward lower supports.
Before we move forward, check out our last weekly Nifty 50 analysis here.
Monthly Chart: Nifty Remains Inside the Mother-Candle Range
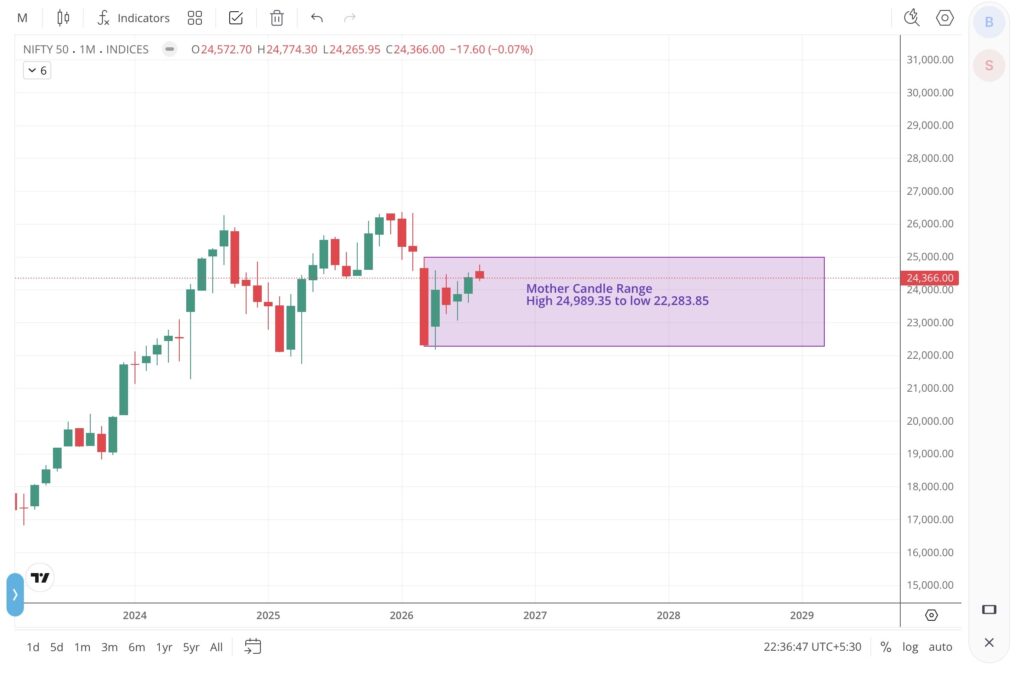
The monthly chart continues to provide the broader framework for the Nifty 50.
The index remains inside the monthly mother-candle range, which extends from approximately 22,283.85 on the downside to 24,989.35 on the upside.
With Nifty currently around 24,366, the index is positioned in the upper portion of this broader range.
This is important because 24,989.35 remains the major resistance level on the monthly timeframe. A sustained move above this level would represent a meaningful technical development and could indicate that Nifty is attempting to break out of the larger consolidation structure.
Until that happens, the monthly chart continues to suggest that the index is trading within an established range rather than being in a confirmed breakout.
What the Monthly Chart Says
The monthly structure is therefore relatively straightforward:
Above 24,989.35: The upper boundary of the mother-candle range is breached, improving the possibility of a larger upside move.
Between 22,283.85 and 24,989.35: Nifty remains within the broader consolidation range.
Below 22,283.85: The current monthly structure would face a significant technical breakdown.
For the immediate outlook, however, 24,989.35 is the level bulls need to reclaim.
Weekly Chart: 50 EMA Becomes the Immediate Battleground
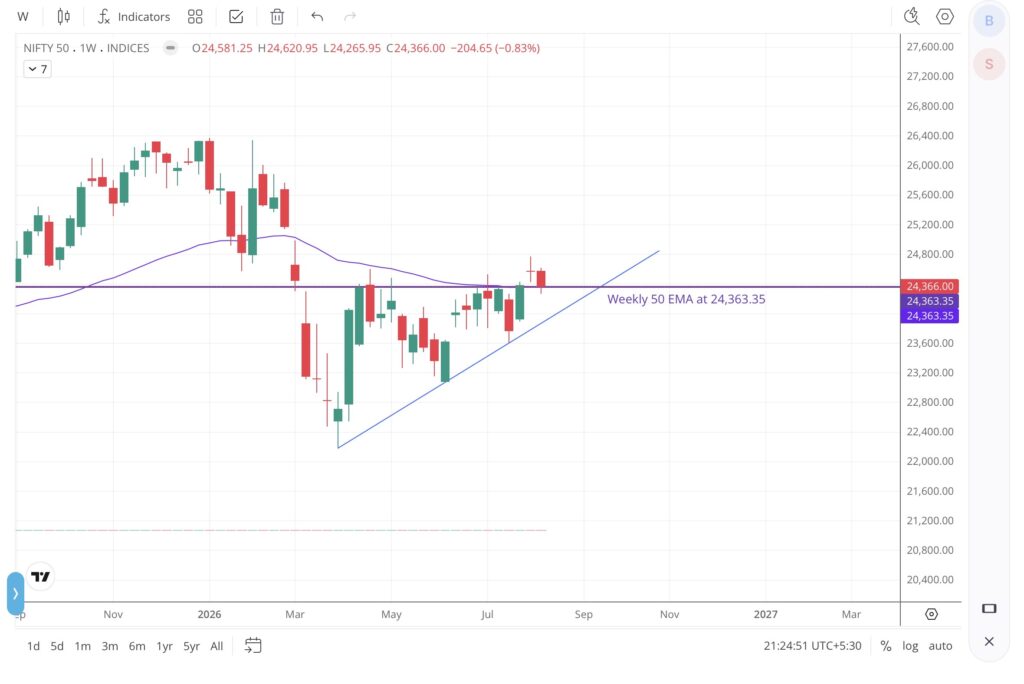
The weekly chart provides a more immediate indication of the current trend. Nifty closed the week at 24,366, almost exactly around the 50-week EMA at 24,363.35.
This makes the coming week’s price action particularly important.
The 50-week EMA is currently acting as a key reference point. Holding above it would help maintain the constructive structure that has developed following the recovery from the April lows.
More importantly, the weekly chart also shows a rising trendline connecting the recent swing lows. This trendline has been supporting the recovery and should continue to be watched closely.
As long as Nifty remains above this rising trendline and manages to hold around the 50-week EMA, the broader recovery structure remains intact.
However, a decisive break below the trendline would weaken the current setup and could bring lower support levels back into focus.
Weekly Takeaway
The weekly chart is therefore at an important decision point:
50-week EMA: 24,363.35
Nifty closed almost exactly at this level, making the next few sessions important for determining whether this area acts as support or resistance. The rising trendline is the second important reference point on the weekly chart.
A successful hold above both would keep the bullish structure alive.
Daily Chart: Mother Candle Breakdown, Recovery Attempt and Key Resistance
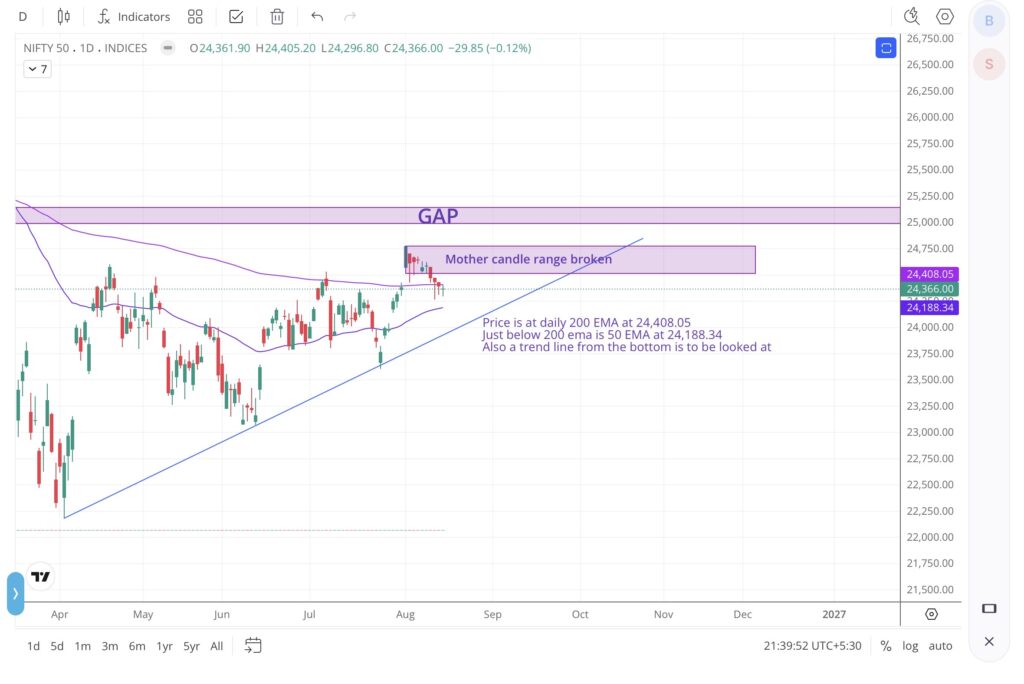
The daily chart shows that Nifty broke down from the marked mother-candle range before recovering from the lower levels. The subsequent move higher has brought the index back toward the upper portion of the broken range, but this should not be interpreted as a confirmed breakout.
This distinction is important because the current price action represents a recovery after the breakdown, rather than a breakout from the mother candle.
Nifty is currently trading around 24,366, with the 200-day EMA at 24,408.05 acting as an immediate hurdle. Just below it, the 50-day EMA at 24,188.34 provides an important support reference.
The rising trendline from the April low also remains relevant. As long as this trendline holds, the recovery attempt can continue. However, the index needs to reclaim the broken mother-candle range convincingly before the daily structure can turn decisively bullish.
24,989.35 Remains the Major Resistance
The more important resistance remains 24,989.35, which is the high of the monthly mother candle. This level is particularly significant because it also marks the start of the gap zone visible on the daily chart.
If Nifty eventually breaks and sustains above 24,989.35, the probability of the index moving into and potentially filling the gap would increase significantly.
Therefore, the daily setup should be viewed in stages:
24,188.34 → 24,408.05 → 24,989.35 → Gap zone
The first two levels determine whether the current recovery can sustain itself. A move above 24,989.35, however, would represent the much more significant bullish development.
What the Daily Chart Says
The daily timeframe is therefore cautiously constructive but not yet bullishly confirmed.
A sustained move above 24,989.35 would significantly strengthen the bullish case and increase the probability of a gap fill.
- The mother candle was broken on the downside.
- Nifty has subsequently recovered from the breakdown.
- The 50-day EMA at 24,188.34 is an important support.
- The 200-day EMA at 24,408.05 is the immediate hurdle.
- The rising trendline remains important on the downside.
- 24,989.35 is the major monthly resistance and the beginning of the gap.
- A sustained move above 24,989.35 would significantly strengthen the bullish case and increase the probability of a gap fill.
The Gap Above 24,989.35 Is the Bigger Upside Trigger
The most important feature on the daily chart is the gap zone above 24,989.35. The monthly mother candle high at 24,989.35 also marks the starting point of this gap.
This makes 24,989.35 more than just another resistance level.
It is the major resistance of the monthly mother candle and the beginning of the gap zone.
If Nifty manages to break and sustain above 24,989.35, the probability of the index attempting to fill the gap becomes significantly higher.Therefore, the sequence to watch is:
24,408 → 24,989 → Gap zone
The first hurdle is the daily 200 EMA. The bigger breakout trigger is 24,989.35.
A sustained move above 24,989.35 would change the technical setup considerably and increase the possibility of a move into the gap.
Rising Trendline Remains Important on the Downside
While the upside levels are getting most of the attention, the rising trendline visible on the daily chart should not be ignored.
The trendline has been developing from the April low and has continued to support the recovery. As long as Nifty respects this trendline, the sequence of higher lows remains broadly intact.
A decisive break below the trendline would therefore be an early warning that the current recovery structure is weakening.
The 50-day EMA at 24,188.34 would then become an important secondary support area.
This gives traders a relatively clear framework:
- Above the rising trendline: recovery structure remains intact.
- Below the trendline: caution increases.
- Below the 50-day EMA: short-term weakness becomes more meaningful.
- Below major swing supports: the broader recovery structure could come under greater pressure.
Multi-Timeframe View
When the three timeframes are put together, the picture becomes clearer.
Monthly
Nifty remains inside the 22,283.85–24,989.35 monthly mother-candle range. The upper boundary at 24,989.35 remains the major resistance.
Weekly
The index is sitting around the 50-week EMA at 24,363.35, while the rising trendline continues to provide an important structural support.
Daily
Nifty is trading around the 200-day EMA at 24,408.05, with the 50-day EMA at 24,188.34 providing another important support.
The daily mother-candle breakout is being tested, while the gap beginning around 24,989.35 remains the major upside objective if the monthly resistance is convincingly broken.
Overall Reading
The three timeframes are not giving a clean bearish signal.
Instead, they are showing an index sitting at an important technical crossroads.
The medium-term structure remains constructive as long as the rising trendline and key moving-average supports hold. But the index still needs to overcome the major monthly resistance before a stronger bullish breakout can be confirmed.
Bull Case
- The bullish scenario would begin with Nifty successfully defending the current support zone around the 50-week EMA and 200-day EMA.
- A move back above 24,408 would be the first positive signal.
- If momentum then builds and Nifty approaches 24,989.35, the market will face its most important resistance of the current setup.
- A decisive breakout above 24,989.35 would be significant because this is both the monthly mother-candle high and the beginning of the marked gap zone.
- If that breakout is sustained, the probability of the gap being filled would increase.
The bullish sequence would therefore be:
Hold 24,188–24,363 → reclaim 24,408 → test 24,989 → break 24,989 → higher probability of gap fill
Bear Case
- The bearish scenario begins if Nifty fails to regain the 200-day EMA and starts losing the support structure underneath.
- A sustained move below the 50-week EMA around 24,363 would be an initial sign of weakness, particularly if the index also breaks the rising trendline.
- The 50-day EMA at 24,188.34 would then become an important support level.
- A decisive break below the rising trendline and subsequent weakness below the 50-day EMA would suggest that the recent recovery is losing momentum.
The deeper monthly support remains 22,283.85, the lower boundary of the monthly mother-candle range. That level is considerably lower and would only become relevant if the broader structure deteriorates significantly.
The bearish sequence would therefore be:
Failure at 24,408 → weakness below 24,363 → break of rising trendline → break below 24,188 → deeper correction risk
What happens when market crashes? Learn more.
What Should Traders Watch Next Week?
The coming week can be viewed through a few clearly defined technical levels.
| Level | Significance |
|---|---|
| 24,989.35 | Major monthly resistance and start of the gap |
| 24,408.05 | Daily 200 EMA |
| 24,363.35 | Weekly 50 EMA |
| 24,188.34 | Daily 50 EMA |
| Rising Trendline | Important dynamic support |
| 22,283.85 | Monthly mother-candle lower boundary |
The most important upside level remains 24,989.35.
The most important immediate support cluster is around 24,188–24,408, with the rising trendline providing additional structural context.
Investor Takeaway
The Nifty 50 enters the coming week at an important technical junction.
The monthly chart continues to show a broader consolidation between 22,283.85 and 24,989.35, while the weekly chart places the index directly around its 50-week EMA. The daily chart adds another layer of significance, with Nifty trading close to the 200-day EMA and the rising trendline still supporting the recovery.
This means the market has support underneath but major resistance overhead.
For the bullish case to strengthen materially, Nifty needs to reclaim the 200-day EMA and eventually challenge 24,989.35. A sustained breakout above that level would be the most important technical development because it could open the possibility of the marked gap being filled.
On the downside, traders should watch the rising trendline and the 24,188.34 50-day EMA closely. A decisive breakdown through these supports would weaken the current recovery structure.
For now, the multi-timeframe setup remains cautiously constructive but not yet in confirmed breakout territory.
Conclusion
The Nifty 50’s technical setup is becoming increasingly important as the index approaches the upper boundary of its broader consolidation range.
The monthly mother-candle high at 24,989.35 remains the major resistance. The weekly chart shows the index testing its 50-week EMA at 24,363.35, while the daily chart places the market around the 200-day EMA at 24,408.05 and above the 50-day EMA at 24,188.34.
The rising trendline from the April low remains another important support to monitor.
The message from the three timeframes is therefore consistent: the market is at a decision point.
A sustained move above 24,989.35 would significantly improve the bullish setup and increase the possibility of the gap being filled. Until then, traders should remain attentive to how Nifty behaves around its moving averages and rising trendline.
On the other hand, a breakdown below the rising trendline and 50-day EMA would weaken the recovery and shift the short-term bias towards caution.
For the coming week, 24,989.35 on the upside and the 24,188–24,408 support cluster on the downside are the levels that deserve the closest attention.
For more practical insights on investing, money management and building long-term wealth, explore our Personal Finance section.
Frequently Asked Questions (FAQs)
1. What is the current Nifty 50 level?
The Nifty 50 closed at 24,366 based on the latest chart data used for this analysis.
2. What is the major resistance for Nifty 50?
The major resistance is 24,989.35, which marks the high of the monthly mother candle. It is also the starting point of the gap zone highlighted on the daily chart.
3. Why is 24,989.35 important for Nifty 50?
The 24,989.35 level is important because it represents the monthly mother-candle high and the beginning of the gap. A sustained breakout above this level could increase the probability of Nifty moving into and potentially filling the gap.
4. What is the Nifty 50 200-day EMA?
The 200-day EMA is at 24,408.05 based on the latest daily chart. With Nifty closing at 24,366, the index is currently just below this important moving average.
5. What is the Nifty 50 50-day EMA?
The 50-day EMA is at 24,188.34. This is an important short-term support level to monitor if Nifty remains below the 200-day EMA.
6. What is the Nifty 50 50-week EMA?
The 50-week EMA is at 24,363.35. Nifty’s latest weekly close of 24,366 is almost exactly at this level, making it an important support/resistance reference for the coming week.
7. Did Nifty 50 break out of the daily mother candle?
No. The daily chart shows a breakdown from the mother-candle range, followed by a recovery attempt. The recent recovery should therefore not be treated as a confirmed breakout unless Nifty convincingly reclaims the relevant range and resistance levels.
8. What is the rising trendline on the Nifty 50 chart?
The rising trendline connects the recovery lows from the April bottom and has been providing dynamic support to the index. A decisive break below this trendline could weaken the current recovery structure.
9. What are the key support levels for Nifty 50?
The immediate support references are the 50-day EMA at 24,188.34, the rising trendline and the broader monthly mother-candle low at 22,283.85. The 50-week EMA at 24,363.35 is also an important technical reference.
10. What happens if Nifty 50 breaks above 24,989.35?
A sustained move above 24,989.35 would be a significant bullish development. Since this level is also the beginning of the marked gap, such a breakout could increase the probability of Nifty moving higher into the gap zone.
11. What happens if Nifty 50 breaks below the rising trendline?
A decisive break below the rising trendline would indicate that the current recovery is losing strength. Traders would then need to monitor the 50-day EMA at 24,188.34 and subsequent support levels for signs of further weakness.
12. What is the bullish scenario for Nifty 50?
The bullish scenario would involve Nifty holding the current support zone, reclaiming the 200-day EMA at 24,408.05, and eventually breaking above 24,989.35. A sustained move above the latter could increase the probability of a gap-fill move.
13. What is the bearish scenario for Nifty 50?
The bearish scenario would develop if Nifty fails to reclaim the 200-day EMA, loses the 50-week EMA, and subsequently breaks the rising trendline and 50-day EMA at 24,188.34. Such price action would weaken the current recovery structure.
14. Is the Nifty 50 trend currently bullish or bearish?
The multi-timeframe setup is cautiously constructive but not decisively bullish. The index is holding important medium-term support structures, but it remains below the major monthly resistance at 24,989.35.
15. What are the most important Nifty 50 levels to watch next week?
The key levels are:
- 24,989.35: Major monthly resistance and start of the gap
- 24,408.05: Daily 200 EMA
- 24,363.35: Weekly 50 EMA
- 24,188.34: Daily 50 EMA
- Rising trendline: Dynamic support
- 22,283.85: Monthly mother-candle lower boundary
Check-out our next week’s Nifty 50 Analysis here.
Disclaimer
Disclaimer: This article is for informational and educational purposes only and should not be considered investment advice, a recommendation, or a solicitation to buy or sell any security, index, derivative or financial instrument. The technical analysis is based on the chart data and indicators available at the time of writing and may change as market conditions evolve. Technical levels, support, resistance and potential scenarios are not guaranteed outcomes. Investors should conduct their own research and consider their financial goals, risk tolerance and investment horizon before making any investment decision.
Looking to sharpen your technical analysis skills? Explore these recommended books and learning resources for understanding charts, indicators, and market trends.
Top Rates Books on Amazon:
Technical Analysis Made Easy: A Beginner to Advanced Guide to Price Action Trading