

Nifty 50 Weekly Analysis: 28 Sep 2026 Key Levels
The Nifty 50 weekly analysis enters another critical phase after the warning highlighted in our previous article played out on the charts. Last week, we identified the newly formed Daily mother candle as the key short-term structure and specifically noted that a break below its low could put the 23,070.15 support under pressure.
That is exactly what followed.
The Daily mother candle had a low of 23,118.60. Nifty subsequently broke below that level and also slipped below 23,070.15, the support we had been tracking. On September 28, selling intensified sharply, with Nifty falling 360.25 points, or 1.56%, to close at 22,780.25. The index touched an intraday low of 22,762.20.
This makes the current Nifty 50 weekly analysis particularly important because the index has now moved away from the immediate 23,000–23,500 structure and is approaching a much more significant support cluster.
The Weekly chart shows support between approximately 22,383.69 and 22,182.55, while the Monthly chart shows the Monthly 50 EMA around 22,060.14, along with a major rising trendline and the lower portion of the Monthly Mother Candle Range in the same broader area.
In other words, Nifty is now approaching a zone where multiple timeframes are pointing toward support.
Last Week’s Nifty 50 Analysis vs What Actually Happened
Before looking at the current setup, let’s revisit what we discussed in last week’s Nifty 50 weekly analysis.
The previous article focused heavily on the Daily mother candle, whose range was approximately 23,118.60–23,592.85. We highlighted that the eventual break from this range could provide the next directional signal.
More importantly, we specifically warned that if the mother candle low broke, the next important question would be whether 23,070.15 support could continue to hold.
The market subsequently broke below the mother candle low.
Nifty’s September 24 session closed at 23,063.10, taking the index below both the mother candle low of 23,118.60 and the 23,070.15 support level.
There was a brief recovery attempt on September 25, when Nifty closed at 23,140.50, but the recovery did not sustain.
Then came Monday, September 28.
Nifty opened at 23,064.90, moved as high as 23,080.25, but selling pressure intensified and the index eventually fell to 22,780.25, with an intraday low of 22,762.20.
So, the sequence discussed in last week’s article played out in stages:
Mother candle low breaks → 23,070 support breaks → recovery fails → sharper correction follows.
This is precisely why tracking multiple timeframes is useful in technical analysis. A single level does not tell the entire story; the reaction after a level breaks can reveal where the next important area may be.
Nifty 50 Monthly Analysis: Major Support Is Getting Closer
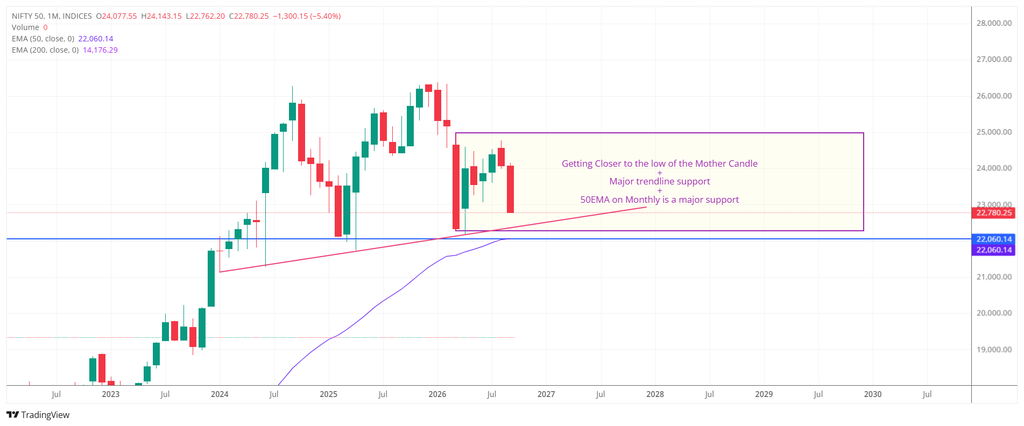
The Monthly chart is now becoming increasingly important.
Nifty closed at 22,780.25 on September 28, while the Monthly 50 EMA is around 22,060.14.
The chart also shows a rising long-term trendline approaching the current price area. At the same time, the lower boundary of the broad Monthly Mother Candle Range is around 22,283.85.
This creates an interesting confluence.
Nifty is currently trading only around 500 points above the Monthly 50 EMA, while the mother candle low and rising trendline are also approaching the same broader region.
The chart therefore highlights a potential support cluster roughly between 22,000 and 22,400.
This is important because the current correction has not yet reached the Monthly 50 EMA.
The 22,283.85 Monthly Mother Candle low is one level to watch, while 22,060.14, the Monthly 50 EMA, sits slightly below it.
The rising trendline shown on the Monthly chart also approaches this area.
Therefore, the Monthly Nifty 50 weekly analysis suggests that the index is moving closer to an area where several longer-term technical supports could potentially interact.
That does not mean support must hold. It simply means that the 22,000–22,400 region deserves significantly more attention than the levels that have already been broken.
Nifty 50 Weekly Analysis: 22,383–22,182 Is the Next Major Zone
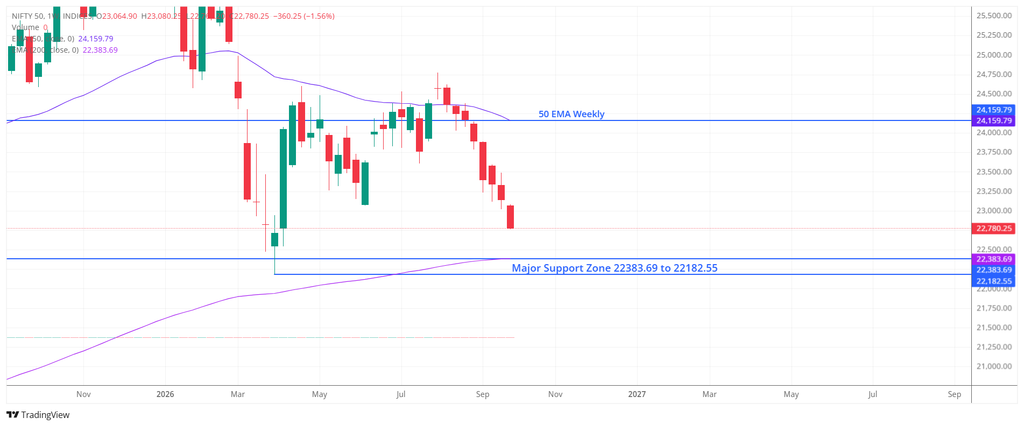
The Weekly chart has now become particularly important because Nifty is approaching the support area marked on the chart.
The Weekly 50 EMA stands at approximately 24,159.79.
Nifty remains significantly below this moving average, which means the Weekly structure continues to show weakness.
More importantly, the Weekly chart identifies a Major Support Zone between 22,383.69 and 22,182.55.
This is now one of the most important areas in our current Nifty 50 weekly analysis.
The upper boundary of this zone is around 22,383.69, while the lower boundary is around 22,182.55.
Nifty’s Monday low of 22,762.20 means the index has not yet reached this zone.
That distinction is important.
The market has moved closer to major support, but the support zone has not yet been tested based on Monday’s low.
Therefore, the next few sessions could become important in determining how price behaves as it approaches 22,383–22,182.
Nifty 50 Daily Analysis: Mother Candle Breakdown Has Played Out
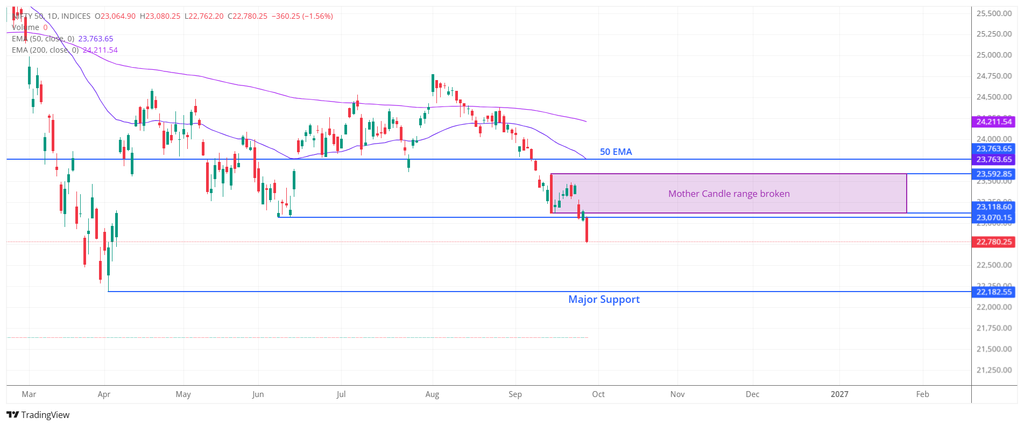
The Daily chart provides the clearest explanation for the recent move.
Last week’s Daily chart showed the 23,118.60–23,592.85 mother candle range.
That range has now been broken on the downside.
The breakdown also took Nifty below the 23,070.15 support that had been highlighted in the previous article.
The current Daily close is 22,780.25, while the Daily 50 EMA has moved to approximately 23,763.65.
This creates a significant gap between the current price and the Daily 50 EMA.
For any meaningful short-term recovery, Nifty would first need to start building a base and then reclaim the Daily 50 EMA around 23,763.65.
Until that happens, the Daily chart continues to show a weak structure.
There is also another important level on the Daily chart: the 200 EMA at approximately 24,211.54.
That is considerably higher and is not an immediate level for the current setup, but it remains relevant as a higher-timeframe resistance if a larger recovery develops.
The Important Shift in the Current Nifty Setup
The key change from last week is that we are no longer waiting to see whether the mother candle will break.
It has broken.
We are also no longer watching 23,070.15 as the primary support.
That level has already broken.
The focus has therefore shifted lower.
The next major question is whether Nifty can find support in the 22,000–22,400 region, where the Weekly and Monthly charts show multiple technical factors.
This is a much more important area than simply looking at one horizontal support line.
Key Nifty 50 Levels to Watch
| Level | Importance | What to Watch |
|---|---|---|
| 24,211.54 | Major resistance | Daily 200 EMA |
| 24,159.79 | Weekly resistance | Weekly 50 EMA |
| 23,763.65 | First recovery hurdle | Daily 50 EMA |
| 23,592.85 | Previous resistance | Mother candle high |
| 23,118.60 | Previous trigger | Mother candle low |
| 23,070.15 | Previous support | Already broken |
| 22,383.69 | Major support | Weekly support zone |
| 22,283.85 | Major support | Monthly Mother Candle low |
| 22,182.55 | Major support | Weekly support zone |
| 22,060.14 | Major support | Monthly 50 EMA |
The important takeaway from this week’s Nifty 50 weekly analysis is that the market has moved from the 23,070 support discussion into the 22,000–22,400 support cluster.
Nifty 50 Bull Case
At the current level, the first requirement for a recovery is for Nifty to stop making fresh lows and establish support.
The immediate focus is therefore not on chasing a recovery but on how price behaves around the 22,383–22,182 Weekly support zone and the nearby Monthly support factors.
If Nifty finds support in this broader area and starts recovering, the first major hurdle on the Daily chart would be the Daily 50 EMA around 23,763.65.
A sustained reclaim of the Daily 50 EMA would be a more meaningful sign of short-term improvement.
Above that, the Weekly 50 EMA at 24,159.79 becomes the next important higher-timeframe hurdle.
Therefore, the recovery sequence to watch is:
22,383–22,182 support zone → 23,763 Daily 50 EMA → 24,159 Weekly 50 EMA
The market would need to reclaim these levels progressively for the technical structure to improve.
Nifty 50 Bear Case
The bearish scenario remains relevant if Nifty continues lower and fails to find support in the 22,383–22,182 zone.
A sustained breakdown below this Weekly support area would bring the Monthly chart into even sharper focus.
The Monthly Mother Candle low around 22,283.85 and Monthly 50 EMA around 22,060.14 are both important longer-term levels.
The Monthly chart also shows the rising trendline approaching this broader area.
Therefore, the 22,000–22,400 region is now the major technical battleground.
A sustained breakdown through this entire cluster would represent a more significant change in the higher-timeframe structure.
For now, however, the key question is whether buyers respond as Nifty approaches this support area.
What Should Traders Watch Next Week?
1. The 22,383–22,182 Weekly Support Zone
This is now the most important area on the Weekly chart.
Nifty has not yet tested this zone after Monday’s decline, so the price reaction here could become particularly important.
2. Monthly Mother Candle Low
The 22,283.85 level is important because it sits within the broader Weekly support area.
The reaction around this level could provide additional information about the strength of the longer-term structure.
3. Monthly 50 EMA
The 22,060.14 Monthly 50 EMA is another major level.
This is one of the strongest technical references visible on the Monthly chart and sits just below the Weekly support cluster.
4. Daily 50 EMA at 23,763.65
For any meaningful short-term bullish signal, Nifty needs to eventually reclaim the Daily 50 EMA.
Until then, the index remains below a key short-term trend indicator.
5. Previous Mother Candle Levels
The 23,118.60–23,592.85 range is no longer acting as the current consolidation range because the downside break has already occurred.
However, if Nifty stages a recovery, these levels can become useful references for understanding whether the breakdown is being reclaimed.
What Caused Monday’s Sharp Correction?
The technical setup explains the price levels, but the broader market environment also contributed to Monday’s sharp decline.
On September 28, Nifty fell 1.56%, while the Sensex declined 1.52%. Reports attributed the broader sell-off to a combination of elevated crude oil prices, rising US bond yields, geopolitical uncertainty and continued foreign investor selling.
Crude oil was particularly important for the session, with reports noting that Brent prices moved above $100 as uncertainty around the US-Iran situation increased.
These external factors do not replace the technical analysis, but they can help explain why the breakdown of already-weakened support levels was followed by a sharp move lower.
Nifty 50 Weekly Analysis: What Comes Next?
This week’s Nifty 50 weekly analysis is a continuation of the setup we discussed last week — but with the market having moved to the next stage.
Last week, we highlighted the Daily mother candle and warned that a break below its low could put 23,070.15 under pressure.
The mother candle low broke.
The 23,070.15 support subsequently broke.
And on Monday, Nifty saw a sharp 1.56% correction, closing at 22,780.25.
The focus has now shifted to the next major support region.
The Weekly chart shows 22,383.69–22,182.55 as a major support zone, while the Monthly chart shows the 22,283.85 mother candle low, the rising trendline and the 22,060.14 Monthly 50 EMA clustered around the broader 22,000–22,400 region.
This makes the next phase of the Nifty 50 weekly analysis particularly interesting.
If Nifty finds support in this zone, the market could attempt a recovery, with 23,763.65 — the Daily 50 EMA — becoming the first major recovery hurdle.
If the support cluster fails, however, the Monthly chart would need to be reassessed because several important higher-timeframe supports would have been breached.
For now, the 22,000–22,400 region is the area to watch most closely.
FAQs
What is the Nifty 50 weekly analysis for this week?
The current Nifty 50 weekly analysis focuses on the breakdown of the Daily mother candle and the subsequent breach of 23,070.15 support. The next major area to watch is the 22,000–22,400 region, where multiple Weekly and Monthly supports converge.
What happened to the Nifty 50 mother candle?
The Daily mother candle range was approximately 23,118.60–23,592.85. Nifty subsequently broke below the mother candle low, confirming the downside scenario discussed in the previous week’s analysis.
What happened after the mother candle broke?
After breaking the mother candle low, Nifty also moved below the 23,070.15 support. The index later experienced a sharper correction on September 28, closing at 22,780.25.
What is the next support for Nifty 50?
The Weekly chart shows a major support zone between 22,383.69 and 22,182.55. The Monthly chart also has important support factors around the same broader region, making approximately 22,000–22,400 the key area to watch.
What is the Nifty 50 Monthly 50 EMA?
The Monthly 50 EMA is currently around 22,060.14. It is an important longer-term technical support level and sits just below the broader Weekly support zone.
What is the Nifty 50 Weekly 50 EMA?
The Weekly 50 EMA is currently around 24,159.79. Nifty is significantly below this level, so a sustained reclaim would represent a meaningful recovery on the Weekly timeframe.
What is the Nifty 50 Daily 50 EMA?
The Daily 50 EMA is currently around 23,763.65. It is the first major moving-average resistance to watch if Nifty attempts a short-term recovery.
What is the major support zone for Nifty 50?
The current major support area is approximately 22,000–22,400. Within this zone are the Weekly support area of 22,383.69–22,182.55, the Monthly Mother Candle low around 22,283.85 and the Monthly 50 EMA around 22,060.14.
What is the bullish scenario for Nifty 50?
The first requirement would be for Nifty to find support around the 22,383–22,182 area and establish a recovery. A sustained reclaim of the Daily 50 EMA around 23,763.65 would provide a more meaningful short-term recovery signal, followed by the Weekly 50 EMA around 24,159.79.
What is the bearish scenario for Nifty 50?
The bearish scenario would strengthen if Nifty decisively breaks through the 22,000–22,400 support cluster. Such a move would mean that several Weekly and Monthly support references are failing together and would require reassessing the higher-timeframe structure.
Should traders rely only on Nifty 50 technical analysis?
No. Technical analysis can help identify trends, support, resistance and potential scenarios, but it cannot guarantee future price movements. Global markets, crude oil, interest rates, geopolitical developments, institutional flows and economic data can all influence Nifty.
Disclaimer
Disclaimer: This Nifty 50 analysis is for educational and informational purposes only. It is based on technical charts, price action, moving averages, support/resistance levels and other market observations available at the time of writing. Technical analysis does not guarantee future price movements, and markets can move unpredictably due to economic data, global events, news, institutional flows and other factors. This article should not be considered investment advice or a recommendation to buy, sell or hold any security. Readers should conduct their own research, consider their risk tolerance and investment objectives, and consult a SEBI-registered financial advisor before making any investment or trading decisions.