

Nifty 50 Weekly Analysis: 7 Crucial Support Levels as Bullish Harami Forms
The latest Nifty 50 weekly analysis brings our attention back to support, with the index showing an interesting reaction after the sharp selling seen on October 8. Although a large red candle appeared on the Daily chart, the absence of strong follow-through selling is worth watching, particularly because Nifty is now sitting near several important support levels across the Daily, Weekly and Monthly timeframes.
In our previous Nifty 50 weekly analysis, we highlighted the major support zone around 22,383–22,182 after Nifty moved into the lower end of its broader technical structure. That zone remains central to the current setup.
The latest chart shows Nifty closing at 22,520.45, with an intraperiod low of 22,179.90. On the Daily timeframe, price has again reacted around the support we marked earlier. On the Weekly chart, the 200-week EMA near 22,382.96 remains an important reference, while the Monthly chart brings the mother candle range, the rising long-term trendline and the 50-month EMA near 22,072.17 into focus.
The immediate question is whether this support cluster can continue to hold and allow a recovery to develop, or whether another round of selling will push Nifty toward the next lower support. A potential Bullish Harami pattern is also forming on the Daily chart, making the coming week’s price action particularly important. However, the pattern still needs confirmation, and it would be premature to call this a confirmed reversal.
1. Last Week’s Nifty 50 Analysis vs What Actually Happened
Last week, our focus was on the support zone that had become relevant after Nifty broke below the Daily mother candle and the earlier support around 23,070. The next area to watch was the region around 22,383–22,182, where important technical references were converging.
This week, Nifty moved deeper into that zone. The sharp red candle on October 8 brought price toward the lower boundary of the support area, but the selling was not followed by an equally strong continuation to the downside. Instead, price showed a reaction around the levels we had marked.
That reaction is encouraging, but it does not yet establish a bullish reversal. The distinction matters: support can produce a temporary bounce without immediately changing the broader trend. Nifty remains below its Daily 50 EMA and Daily 200 EMA, while the Weekly 50 EMA is also considerably higher than the current price.
The key takeaway from this week is that the support zone is being tested, and buyers have started to respond. Next week, we need to see whether that response develops into sustained upward price action or whether the index revisits the recent low.
2. Monthly Chart: The 50 EMA and Long-Term Trendline Remain Important
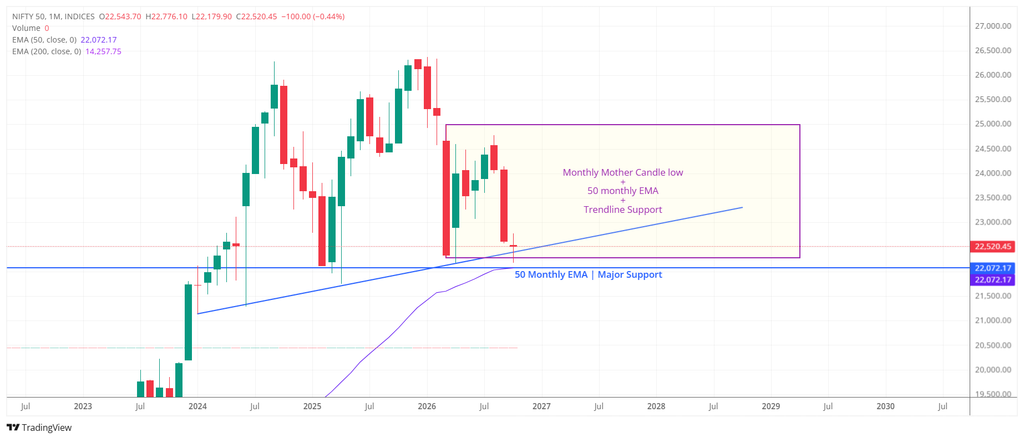
The Monthly chart continues to provide the broader context for this correction. Nifty is approaching a region where several long-term technical references converge: the lower boundary of the Monthly mother candle range, the rising trendline originating from the 2023–2024 area, and the 50-month EMA.
The current chart places the 50-month EMA at approximately 22,072.17. This is an important level to monitor if Nifty breaks below the recent low and the nearby support zone fails to hold. The moving average is not a guaranteed floor, but it provides a significant higher-timeframe reference where buyers may attempt to defend the index.
The Monthly mother candle range also remains relevant. Its lower boundary is around 22,283.85 on our marked chart. Nifty’s recent low of 22,179.90 moved below that reference during the period, so we should not describe the mother candle low as having held perfectly. Instead, the important question is whether Nifty can regain and sustain itself around this boundary while the Monthly 50 EMA and rising trendline remain nearby.
This is where the multi-timeframe confluence becomes important. A reaction from one level alone may not be enough to change the trend, but the proximity of the Monthly 50 EMA and the long-term trendline adds significance to the broader support region. At the same time, repeated tests of the same trendline can eventually weaken it, so the quality of the next reaction matters as much as the level itself.
For the coming week, the Monthly chart reinforces our central message: watch the support reaction carefully. A sustained hold and recovery would help stabilize the broader structure. A decisive breakdown through the support cluster, on the other hand, would make the Monthly 50 EMA near 22,072.17 an important next reference.
3. Weekly Chart: The 200 EMA Is the Immediate Battleground
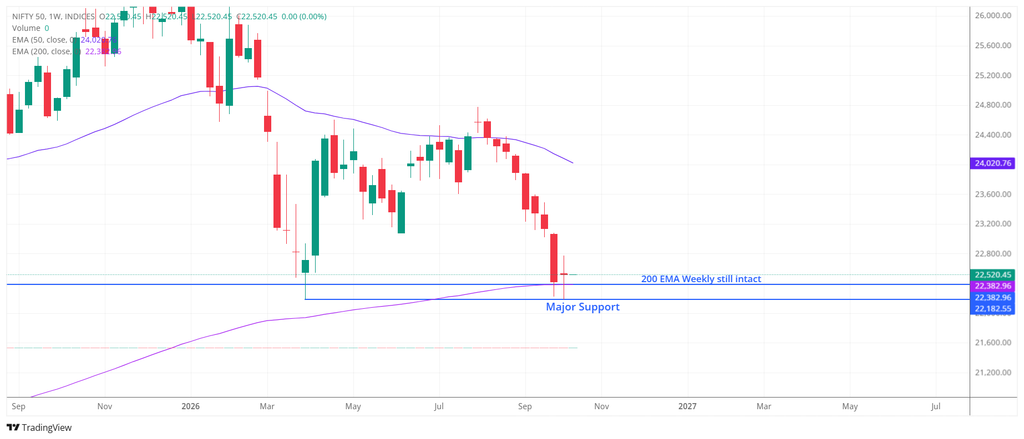
The Weekly chart offers one of the most important signals in the current Nifty 50 weekly analysis. Nifty has approached and reacted around the 200-week EMA at approximately 22,382.96, which is now a critical level to monitor in the coming weeks.
The index has also shown a relatively sideways reaction around this region after the sharp decline. This suggests that the market is attempting to stabilize, but sideways movement near support should not automatically be interpreted as accumulation or a confirmed bottom. We need to see whether buyers can defend the level through subsequent weekly candles.
The marked support zone extends from approximately 22,382.96 down to 22,182.55. The 200-week EMA sits near the upper part of this area, while 22,182.55 is the lower boundary we have been tracking. As long as Nifty remains around this zone and avoids a decisive breakdown, the possibility of a recovery remains open.
However, the broader Weekly structure is still weak. The Weekly 50 EMA is around 24,020.76, substantially above the current close of 22,520.45. Nifty would need to recover considerably before this moving average becomes an immediate upside test. For now, the priority is not to forecast a move toward the 50 EMA, but to determine whether the 200-week EMA and the lower support zone can withstand further selling.
The coming weeks will be particularly important. If the 200-week EMA remains intact and Nifty begins to form a stronger base, it could help the index stabilize. If price breaks decisively below the 200-week EMA and the marked support zone, the current support thesis would weaken considerably.
4. Daily Chart: Bullish Harami Formation Is Worth Watching
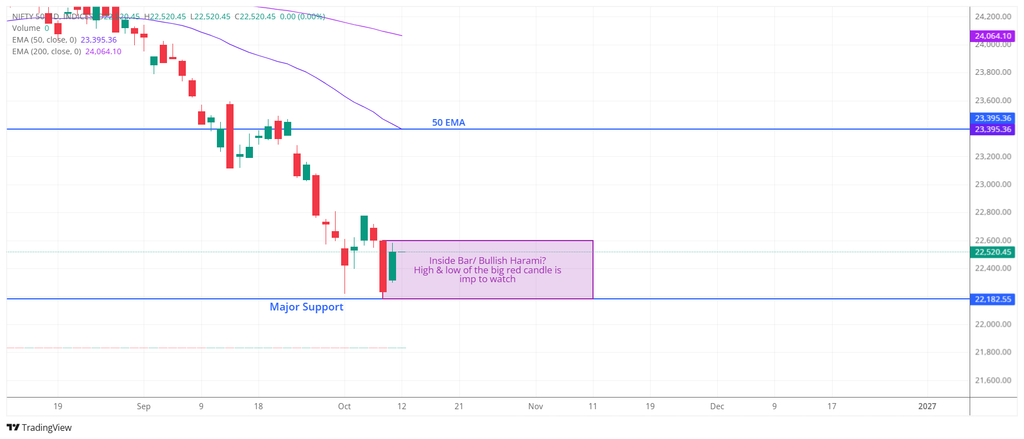
The Daily chart gives us the clearest picture of the immediate setup. On October 8, Nifty formed a large red candle as selling pushed the index toward the major support at 22,182.55. What makes the current price action interesting is that the sharp decline has not yet been followed by another equally strong bearish move.
The subsequent candle is developing within the range of the preceding large red candle, creating a potential Bullish Harami pattern.
What is a Bullish Harami?
A Bullish Harami is a two-candle pattern that can appear after a decline. The first candle is a large bearish candle, followed by a smaller bullish candle whose real body sits within the real body of the previous bearish candle. It suggests that the selling momentum may be slowing and buyers could be starting to respond.
However, a Bullish Harami is a potential reversal signal, not a guarantee. Traders generally look for confirmation from the following candle, ideally through a move above the pattern’s high and sustained buying pressure.
For Nifty, the pattern is particularly relevant because it is forming near a major support zone rather than in the middle of an established uptrend. The combination of support and a potential reversal pattern makes this setup worth monitoring closely.
The High and Low of the Large Red Candle Matter
The immediate focus should be on the high and low of the large red candle. These levels define the range that price needs to resolve.
- A break above the large red candle’s high: This would provide a stronger confirmation that buyers are regaining control and could improve the short-term recovery setup.
- Price remaining inside the candle’s range: This would indicate continued indecision. The market may need more time to establish a directional move.
- A break below 22,182.55: This would weaken the current support setup and raise the possibility of a deeper correction, bringing the Monthly 50 EMA near 22,072.17 into focus.
The Daily 50 EMA is currently around 23,395.36, while the Daily 200 EMA is near 24,064.10. Both remain well above the current price. Even if the Bullish Harami receives confirmation, Nifty would still need to overcome these higher resistance references before the Daily trend could be considered materially stronger.
For now, the pattern is an early signal to watch, not a reason to assume that the correction is over.
5. Key Nifty 50 Support and Resistance Levels to Watch
The following levels are based on the latest chart annotations. They serve different purposes across the three timeframes, so they should not be treated as interchangeable.
| Level | Timeframe | Technical significance |
|---|---|---|
| 24,064.10 | Daily | 200 EMA; higher recovery hurdle |
| 24,020.76 | Weekly | 50 EMA; broader recovery reference |
| 23,395.36 | Daily | 50 EMA; first major moving-average hurdle |
| 22,520.45 | Current close | Current price reference |
| 22,382.96 | Weekly | 200 EMA; immediate higher-timeframe support |
| 22,283.85 | Monthly | Approximate lower boundary of the Monthly mother candle range |
| 22,182.55 | Daily / Weekly | Major marked support and critical downside reference |
| 22,072.17 | Monthly | 50 EMA; next important support reference if lower support fails |
The main area to watch remains 22,182.55–22,382.96. The 200-week EMA is near the upper end of this zone, while 22,182.55 marks the lower support level highlighted on our charts.
If Nifty stabilizes here, the next challenge will be to develop a stronger recovery and eventually reclaim the Daily 50 EMA at 23,395.36. If the support zone breaks decisively, the Monthly 50 EMA at 22,072.17 becomes an important next reference.
6. Bull Case: Support Holds and the Harami Gets Confirmation
The bullish scenario begins with Nifty defending the current support region. The first positive development would be a sustained hold around the 200-week EMA and the marked 22,182.55 support, followed by a decisive move above the high of the large red Daily candle.
If the potential Bullish Harami receives confirmation, it could signal that selling pressure is easing. A stronger recovery would then bring the Daily 50 EMA at 23,395.36 into focus. Reclaiming that level would improve the short-term structure, although the index would still need to contend with the Weekly 50 EMA at 24,020.76 and the Daily 200 EMA at 24,064.10.
The bullish case therefore depends on a sequence of developments: support holding first, the Daily pattern receiving confirmation next, and price subsequently reclaiming important moving averages. Until those steps occur, any bounce should be treated as a recovery attempt rather than a confirmed trend reversal.
7. Bear Case: Support Breaks and the Monthly 50 EMA Comes Into Focus
The bearish scenario would strengthen if Nifty fails to sustain its current reaction and breaks below the marked support at 22,182.55. A decisive breakdown would weaken the immediate support structure and increase the risk of further downside.
In that situation, the Monthly 50 EMA at 22,072.17 becomes an important level to monitor. The proximity of this moving average to the recent low makes it a significant reference, but it should not be assumed to hold automatically.
The Monthly mother candle boundary and rising trendline also remain relevant to the broader structure. If Nifty continues to weaken through this entire cluster, the technical picture would deteriorate further. The market would then need to establish a new support base rather than relying on the current levels.
The bearish case does not require an immediate collapse. Even a failed bounce followed by a sustained move below support would be enough to signal that buyers have not yet established control.
What Should Traders Watch Next Week?
The coming week is primarily about reading the reaction around support and determining whether the developing Daily pattern receives confirmation.
First, watch the high and low of the large red Daily candle from October 8. A break above its high would strengthen the potential Bullish Harami setup, while a break below its low would signal renewed weakness. The marked support at 22,182.55 remains the crucial downside reference.
Second, watch the Weekly 200 EMA at 22,382.96. The next few weekly candles should help determine whether this moving average continues to act as support or whether Nifty begins to sustain below it. A sideways reaction is not enough on its own; the quality of the subsequent price action will matter.
Finally, keep the Monthly chart in view. The 50-month EMA at 22,072.17 is the next important reference if the current support region fails. Meanwhile, a recovery toward the Daily 50 EMA at 23,395.36 would be an early sign that the short-term structure is improving.
Investor Takeaway: Support Remains the Story
This week’s Nifty 50 weekly analysis points to a market attempting to stabilize after a sharp decline. The Daily chart shows a potential Bullish Harami forming near marked support, the Weekly chart highlights the 200 EMA around 22,382.96, and the Monthly chart brings the 50 EMA near 22,072.17 and the rising trendline into focus.
These developments make the current region technically significant, but they do not yet confirm that a durable bottom is in place. The lack of strong downside follow-through after the October 8 candle is encouraging; the next step is to see whether buyers can convert that pause into a sustained recovery.
For the coming week, 22,182.55 remains the key downside level, while the high of the large red Daily candle is important for confirming the potential Bullish Harami. If support holds and price starts moving higher, the Daily 50 EMA at 23,395.36 becomes an important recovery hurdle. If support fails, the Monthly 50 EMA at 22,072.17 moves into focus.
For now, there is no need to predict the next major move in advance. The charts have already given us the levels to watch. The next direction should become clearer from how Nifty behaves around them.
Frequently Asked Questions
1. What is the key support level for Nifty 50 next week?
The major marked support is 22,182.55, with the Weekly 200 EMA at approximately 22,382.96 forming another important reference. Together, they define the immediate support zone to watch.
2. What is the Weekly 200 EMA level for Nifty 50?
The latest chart shows the Weekly 200 EMA at approximately 22,382.96. Nifty’s ability to sustain around this moving average will be important in the coming weeks.
3. What is a Bullish Harami pattern?
A Bullish Harami is a two-candle pattern in which a smaller candle’s real body forms within the real body of the preceding large bearish candle after a decline. It can suggest that selling momentum is slowing, but traders generally look for confirmation before treating it as a potential reversal.
4. Is the Bullish Harami on Nifty 50 confirmed?
Not yet. The Daily chart shows a potential Bullish Harami formation. A decisive move above the high of the large red candle would provide stronger confirmation, while a break below the support region would weaken the setup.
5. What happens if Nifty 50 breaks below 22,182.55?
A decisive breakdown below 22,182.55 would weaken the current support structure. The Monthly 50 EMA near 22,072.17 would then become an important next reference, although there is no guarantee that it will hold.
6. What is the Monthly 50 EMA for Nifty 50?
The latest chart places the Monthly 50 EMA at approximately 22,072.17. It is an important higher-timeframe reference if Nifty breaks below the current support zone.
7. What are the major resistance levels for Nifty 50?
The Daily 50 EMA at 23,395.36 is the first major moving-average hurdle on the chart. Above that, the Weekly 50 EMA at 24,020.76 and Daily 200 EMA at 24,064.10 form a higher resistance area to monitor.
8. Is Nifty 50 bullish or bearish right now?
The broader trend remains under pressure because Nifty is trading below its Daily 50 EMA, Daily 200 EMA and Weekly 50 EMA. However, the reaction near the Weekly 200 EMA and the potential Bullish Harami suggest that a short-term stabilization attempt is possible. Confirmation is still needed.
9. What should traders watch in Nifty 50 next week?
Traders should monitor the high and low of the October 8 Daily candle, support at 22,182.55, the Weekly 200 EMA at 22,382.96, and the Monthly 50 EMA at 22,072.17. The next directional move will depend on whether support holds and price confirms a recovery or breaks down further.
Disclaimer
Disclaimer: This Nifty 50 analysis is for educational and informational purposes only. It is based on technical charts, price action, moving averages, support/resistance levels and other market observations available at the time of writing. Technical analysis does not guarantee future price movements, and markets can move unpredictably due to economic data, global events, news, institutional flows and other factors. This article should not be considered investment advice or a recommendation to buy, sell or hold any security. Readers should conduct their own research, consider their risk tolerance and investment objectives, and consult a SEBI-registered financial advisor before making any investment or trading decisions.