

Nifty 50 Weekly Outlook: Key Levels and Trends to Watch
What Happened?
Check-out our previous week’s analysis.
The Nifty 50 closed the week at 24,570.65, gaining 0.77%. The index continued to hold above its key moving-average supports, keeping the broader structure constructive despite some sideways price action.
The weekly chart shows a close above the 50 EMA, while the daily chart indicates that Nifty is holding above its 200 EMA at 24,406.81.
At the same time, the index remains within the broader monthly mother-candle range of 22,283.85–24,989.35, keeping both the upside and downside levels relevant for the coming sessions.
Key Levels to Watch
- Immediate support: 24,406–24,363
(Daily 200 EMA and Weekly 50 EMA) - Immediate resistance: 24,774
- Major upside zone: 24,989
(Upper boundary of the monthly mother-candle range) - Major downside zone: 22,284
(Lower boundary of the monthly mother-candle range)
The key question for the coming week is whether Nifty can sustain above its moving-average supports and eventually challenge the 24,989 resistance zone, or whether rejection from the current range brings the index back towards lower supports.
Check out our next week’s Nifty 50 analysis here.
Market Structure at a Glance
| Timeframe | Current Setup | Key Level |
|---|---|---|
| Daily | Above 200 EMA; sideways after the recent move higher | 24,406 |
| Weekly | Close above 50 EMA | 24,363 |
| Monthly | Trading inside mother-candle range | 22,284–24,989 |
Overall: The structure remains cautiously positive, but a decisive breakout above the monthly range is still needed for stronger upside confirmation.
Nifty 50 Daily Timeframe Analysis
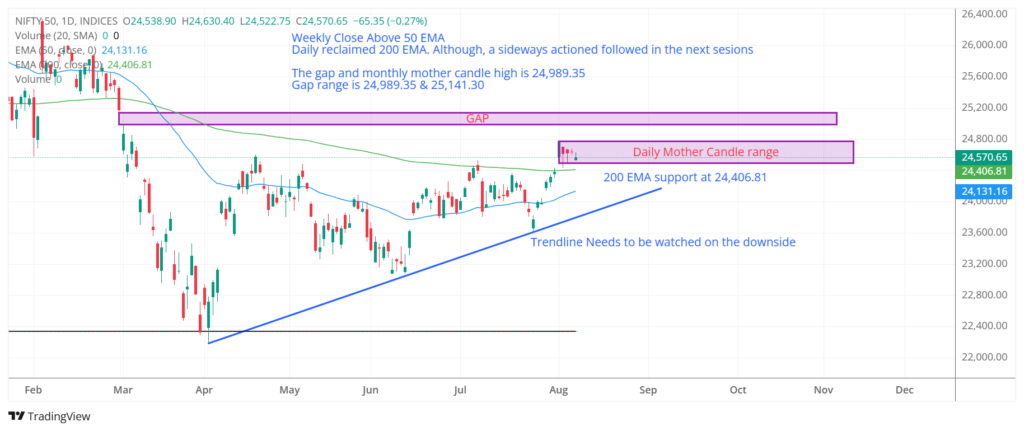
The daily chart shows Nifty 50 holding above its 200 EMA at 24,406.81, keeping the near-term structure constructive.
After the recent recovery, the index is currently consolidating around the 24,500–24,600 zone. The key resistance to watch is 24,989.35, which is the high of the monthly mother candle.
Importantly, 24,989.35 is also the starting point of the gap visible on the daily chart, with the gap extending towards 25,141.30. If Nifty decisively breaks and sustains above 24,989.35, the possibility of the index moving into and filling this gap becomes higher.
On the downside, the rising trendline remains an important support zone. A break below the trendline, particularly alongside a move below the 200 EMA, could weaken the current bullish structure.
Key Levels
- Support: 24,406.81 — Daily 200 EMA
- Secondary support: 24,131.16 — Daily 50 EMA
- Trendline: Rising support on the daily chart
- Major resistance: 24,989.35 — Monthly mother-candle high
- Gap zone: 24,989.35–25,141.30
Daily view: The setup remains constructive above the 200 EMA and rising trendline, but 24,989.35 is the key hurdle. A decisive break above this monthly mother-candle high could increase the probability of Nifty moving into the 24,989–25,141 gap zone.
Nifty 50 Weekly Timeframe Analysis
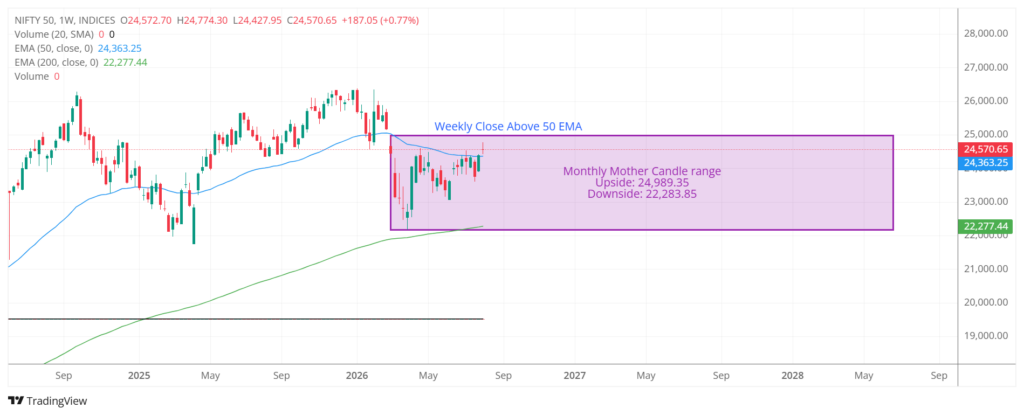
The weekly chart shows Nifty 50 closing at 24,570.65, above its 50 EMA at 24,363.25.
The index has recovered from the earlier decline and is now trading within the broader monthly mother-candle range. The weekly close above the 50 EMA keeps the medium-term structure constructive.
The key focus remains whether Nifty can sustain above the weekly 50 EMA while gradually moving towards the upper boundary of the broader range.
Key Levels
- Weekly 50 EMA: 24,363.25
- Monthly mother-candle upside: 24,989.35
- Monthly mother-candle downside: 22,283.85
Weekly view: The structure remains constructive above 24,363, but Nifty is still trading within the broader mother-candle range. A sustained move towards and beyond 24,989.35 would strengthen the upside setup.
Nifty 50 Monthly Timeframe Analysis
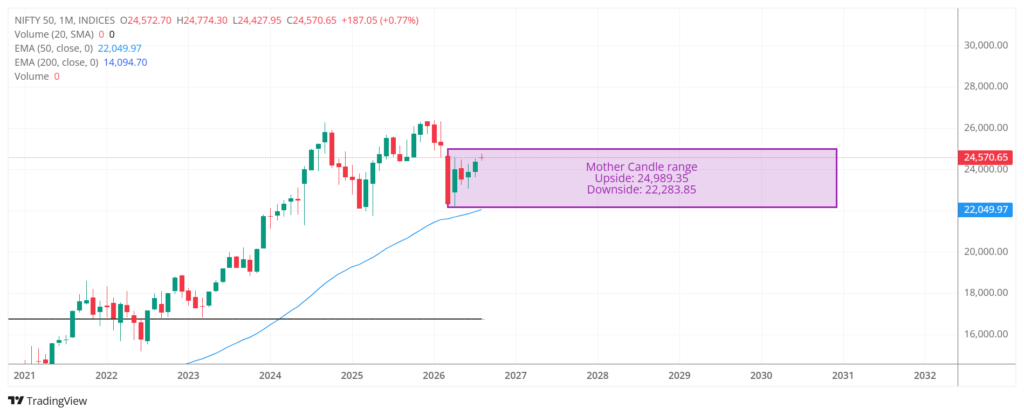
The monthly chart shows Nifty 50 trading within the monthly mother-candle range of 22,283.85–24,989.35.
The index remains comfortably above its 50 EMA at 22,049.97, keeping the broader long-term structure constructive.
For the monthly timeframe, the mother-candle boundaries remain the key reference points. A move above the upper boundary would indicate a potential breakout from the current consolidation, while a break below the lower boundary would materially weaken the broader setup.
Key Levels
- Monthly mother-candle upside: 24,989.35
- Monthly mother-candle downside: 22,283.85
- 50 EMA: 22,049.97
Monthly view: The broader structure remains constructive, but Nifty is still inside the monthly mother-candle range. 24,989.35 remains the key upside level, while 22,283.85 is the major downside boundary.
Connecting the Dots
Across the three timeframes, Nifty 50 maintains a constructive structure, with the daily and weekly charts holding above their key moving-average supports.
The immediate focus is on 24,989.35. This is the monthly mother-candle high and also the starting point of the daily gap. A sustained breakout above this level could open the way towards the 25,141.30 gap zone.
On the downside, the daily 200 EMA at 24,406.81 and the weekly 50 EMA at 24,363.25 form an important support cluster. The broader monthly mother-candle range remains intact unless Nifty makes a decisive move outside its boundaries.
Updates on IPOs coming next week.
Conclusion
Nifty 50 remains cautiously constructive across the daily, weekly and monthly timeframes.
For the coming week, 24,989.35 remains the key level to watch on the upside. A decisive breakout could increase the possibility of filling the daily gap towards 25,141.30.
On the downside, holding above the 24,406–24,363 support zone will be important for maintaining the current structure.
For now, the index remains in a wait-and-watch setup, with the next meaningful directional move likely to depend on how price reacts around these key levels.
RBI Holds Repo Rate at 5.25% as Inflation Risks Rise; MPC Stays Data-Dependent.
Read More.
Frequently Asked Questions (FAQs)
1. What is the current Nifty 50 level?
Nifty 50 closed at 24,570.65 for the week, with the index continuing to hold above key moving-average supports.
2. What is the key resistance for Nifty 50?
The key resistance is 24,989.35, which is the high of the monthly mother candle. It is also the starting point of the gap visible on the daily chart.
3. What happens if Nifty 50 breaks 24,989?
A decisive break and sustained move above 24,989.35 could increase the possibility of Nifty moving into the daily gap zone extending towards 25,141.30.
4. What are the key support levels for Nifty 50?
The immediate support zone is around 24,406–24,363, represented by the daily 200 EMA and weekly 50 EMA respectively. The rising daily trendline is another important support to monitor.
5. What does the daily chart indicate?
The daily chart remains constructive as Nifty trades above its 200 EMA and rising trendline. However, the index is consolidating below the 24,989.35 resistance.
6. What does the weekly chart indicate?
The weekly chart remains constructive above the 50 EMA at 24,363.25. Nifty is still trading within the broader monthly mother-candle range.
7. What does the monthly chart indicate?
The monthly chart shows Nifty trading within the 22,283.85–24,989.35 monthly mother-candle range. The broader structure remains constructive while the index stays within this range.
8. What is the major downside level on the monthly chart?
The lower boundary of the monthly mother candle at 22,283.85 is the major downside reference level.
9. Is Nifty 50 bullish right now?
The multi-timeframe setup is cautiously constructive, with the daily and weekly charts holding above key moving-average supports. However, a decisive breakout above 24,989.35 is still needed for stronger upside confirmation.
10. What should traders watch next week?
The key levels to monitor are 24,989.35 on the upside and the 24,406–24,363 support zone on the downside. Price action around these levels could provide clues about the next directional move.
Leap India IPO Opens: Should Investors Bet on India’s Asset-Pooling Leader?
Disclaimer: This article is for informational and educational purposes only and should not be considered investment or trading advice. The technical analysis and levels discussed are based on the charts available at the time of publication and may change as market conditions evolve. Investors and traders should conduct their own research and consider their risk tolerance before making any investment decisions.
Looking to sharpen your technical analysis skills? Explore these recommended books and learning resources for understanding charts, indicators, and market trends.
Top Rates Books on Amazon:
Technical Analysis Made Easy: A Beginner to Advanced Guide to Price Action Trading