

Nifty 50 Technical Analysis: How Multi-Timeframe Analysis Helps Decode Market Trends
Technical analysis isn’t about predicting where the market will move next. Instead, it’s about understanding the current market structure, identifying important support and resistance levels, and preparing for different scenarios before they unfold.
In our previous Nifty 50 Technical Analysis, we analysed the Monthly, Weekly, and Daily charts independently to understand where buyers and sellers were positioned. This week, we’re taking that analysis one step further by connecting all three timeframes together.
Professional traders rarely rely on a single chart. A Daily chart may suggest that momentum is improving, while the Weekly chart could still be approaching a major resistance level. At the same time, the Monthly chart may indicate that the broader market is simply consolidating within a long-term range. Looking at only one timeframe often leads to incomplete conclusions.
This is where multi-timeframe analysis becomes valuable.
By analysing the Monthly, Weekly, and Daily charts together, we can understand not only the current trend but also where that trend sits within the bigger market structure. In this edition of our Nifty 50 Technical Analysis series, we’ll explain how these three timeframes complement each other, what the latest charts are indicating, and the important technical levels that investors and traders should monitor over the coming weeks.
Last Week’s Analysis Review
Before analysing the latest charts, it’s worth revisiting the key observations from last week’s Nifty 50 Technical Analysis.
Last week, we noted that while the Monthly chart continued to support a constructive long-term outlook, the shorter timeframes were showing signs of weakness. The Weekly chart had rejected the 50 EMA, the Daily chart remained below the 50 EMA, and the resistance zone between 24,354 and 24,407 was identified as the key area that buyers needed to reclaim before sentiment could improve.
Over the past week, the market behaved largely within that framework. Rather than witnessing a decisive breakout, Nifty continued to respect this resistance cluster while gradually improving its short-term structure. The Daily chart has now recovered toward the 200 EMA, the Weekly chart is once again testing the 50 EMA, and both of these levels are now aligning with a descending trendline.
This creates a much more significant technical setup than the one we analysed last week.
This week’s Nifty 50 Technical Analysis therefore focuses on one important question:
Can buyers overcome this confluence of resistance and resume the broader uptrend, or will the market continue consolidating before its next directional move?
To answer that, we’ll analyse the Monthly, Weekly, and Daily charts together rather than in isolation.
Market Structure Meter
| Timeframe | Trend | Current Market Structure |
|---|---|---|
| Monthly | 🟢 Bullish | Long-term trend remains intact, with price continuing to consolidate inside the Mother Candle range. |
| Weekly | 🟡 Improving | Momentum has strengthened as the index attempts to reclaim the Weekly 50 EMA. |
| Daily | 🟡 Neutral | Price is testing the Daily 200 EMA while also approaching a descending trendline resistance. |
Unlike last week, the Daily and Weekly charts are no longer pointing in opposite directions. Instead, both are gradually moving towards the same technical zone. This alignment makes the current Nifty 50 Technical Analysis particularly interesting because the next move could determine the market’s short- to medium-term direction.
Monthly Timeframe Analysis
Technical Chart: Zerodha
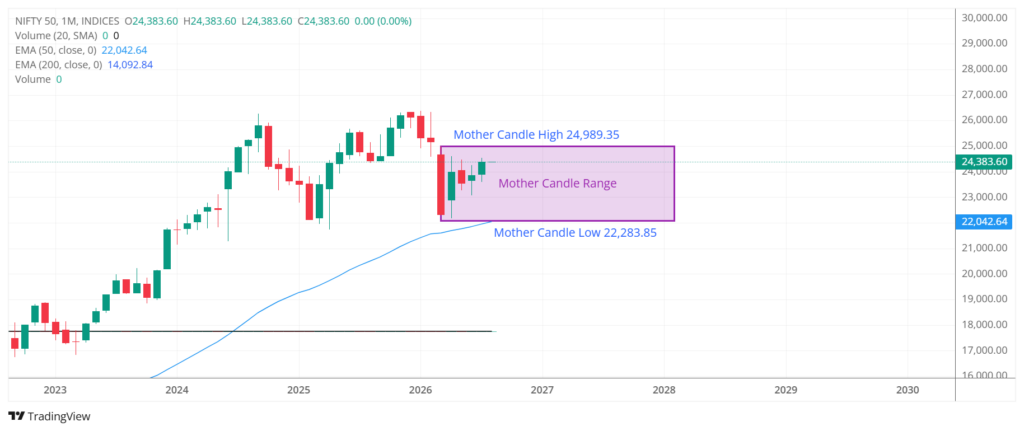
The Monthly chart continues to favour the bulls, with Nifty maintaining its long-term bullish structure above both the 50 EMA and the 200 EMA. Despite the volatility seen over the past few months, there has been no meaningful deterioration in the broader trend.
One of the key observations remains the Mother Candle, within which the index has been consolidating for several months. Rather than indicating weakness, this suggests that the market is taking a breather after a strong rally, with buyers and sellers still searching for the next directional trigger.
The Mother Candle high near 24,989 continues to act as the primary long-term resistance, while the Mother Candle low around 22,284 remains the most important long-term support. Until price breaks out of this range on a monthly closing basis, the broader structure is likely to remain range-bound.
From a moving average perspective, both the 50 EMA and 200 EMA continue to slope higher, reinforcing that the long-term trend remains positive. This suggests that the current price action is better viewed as a consolidation within an uptrend rather than the beginning of a larger bearish reversal.
Monthly Timeframe Conclusion
The Monthly chart continues to provide a constructive backdrop for the market. While Nifty remains locked within the Mother Candle range, the long-term trend is still intact, and the broader structure continues to favour the bulls. Any decisive breakout above the Mother Candle high would strengthen the long-term outlook, whereas the lower boundary remains the key level that long-term investors should monitor.
Weekly Timeframe Analysis
Technical Chart: Zerodha
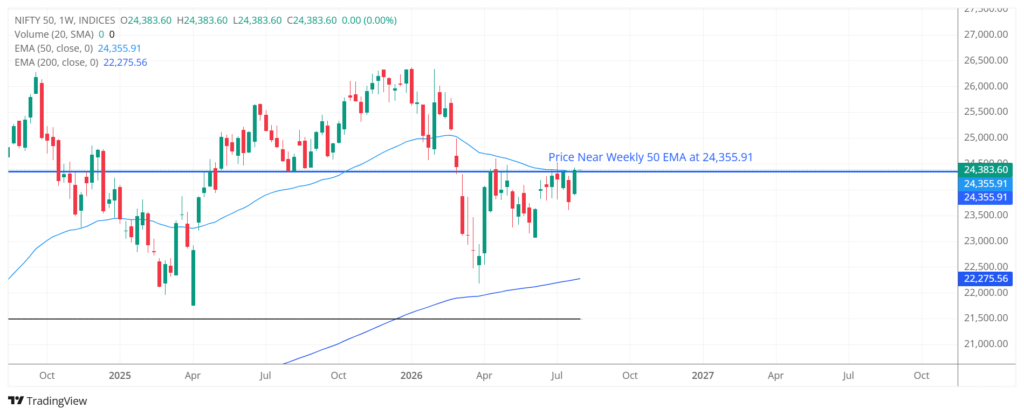
While the Monthly chart confirms that the long-term trend remains healthy, the Weekly chart provides a better understanding of the market’s medium-term momentum. Compared to last week’s analysis, this chart has shown a noticeable improvement.
In our previous analysis, Nifty had faced rejection near the Weekly 50 EMA, allowing sellers to regain short-term control. This week, however, the index has managed to recover from lower levels and is once again testing the same moving average. This indicates that buyers are gradually regaining confidence rather than allowing the correction to deepen.
The Weekly 50 EMA, currently around 24,356, remains the immediate hurdle for the bulls. A sustained move above this level would be the first indication that medium-term momentum is strengthening again. Until then, it continues to act as an important resistance level.
On the downside, the Weekly 200 EMA, positioned near 22,276, continues to provide strong structural support. This level also aligns closely with the Monthly support zone, creating a technically significant area that long-term investors are likely to monitor.
Another encouraging sign on the Weekly chart is that the index has respected higher lows despite recent volatility. Rather than witnessing aggressive selling, buyers have gradually stepped in at lower levels, allowing the market to recover toward resistance once again. This suggests that while momentum is still developing, the broader medium-term structure has started improving compared to last week.
Weekly Timeframe Conclusion
The Weekly chart has shifted from neutral to cautiously bullish. Buyers have regained some momentum after last week’s rejection, but a decisive close above the Weekly 50 EMA is still needed to confirm further strength. Until that happens, this moving average remains the key level to watch.
Daily Timeframe Analysis
Technical Chart: Zerodha
The Daily chart highlights where the immediate battle between buyers and sellers is taking place.
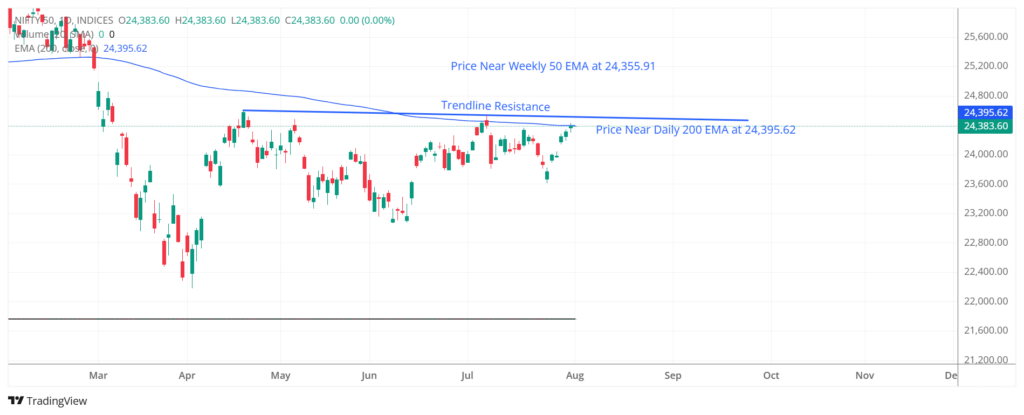
Unlike the Monthly and Weekly charts, which focus on the broader trend, the Daily timeframe helps identify the market’s current decision zone. Looking at the latest chart, Nifty has continued its recovery and is now approaching an important cluster of resistance.
The first resistance comes from the Daily 200 EMA, while the second is the descending trendline connecting the recent swing highs. The fact that both of these technical levels are positioned close to each other makes this zone considerably more important than a single resistance level.
Over the past few sessions, price action has improved, with buyers steadily pushing the index higher after defending lower levels. However, the recovery has now reached an area where fresh buying will need to absorb selling pressure before the next directional move can develop.
A decisive breakout above both the Daily 200 EMA and the descending trendline would significantly improve the short-term technical picture and support the improving momentum already visible on the Weekly chart. On the other hand, another rejection from this zone could result in the index remaining range-bound until a stronger trigger emerges.
For now, the Daily chart suggests that Nifty is approaching an important technical test rather than confirming a breakout.
Daily Timeframe Conclusion
The Daily chart is showing improving price action, but buyers still face a significant resistance cluster. The next few trading sessions will be crucial in determining whether the current recovery develops into a confirmed breakout or another period of consolidation.
Connecting the Dots: What Do All Three Timeframes Tell Us?
When viewed together, all three timeframes present a balanced picture of the current market.
The Monthly chart continues to indicate that the long-term trend remains bullish, with Nifty consolidating within the Mother Candle range rather than showing signs of a structural reversal.
The Weekly chart suggests that momentum is gradually improving as the index attempts to reclaim the Weekly 50 EMA, although a decisive close above this level is still awaited.
Meanwhile, the Daily chart has reached an important resistance zone, where the Daily 200 EMA and the descending trendline converge. The market’s reaction around this area is likely to determine the next short-term move.
Overall, the broader trend remains positive, but confirmation of further upside will depend on whether buyers can successfully overcome the current resistance cluster. Until then, a phase of consolidation cannot be ruled out.
Key Levels to Watch
| Level | Why It Matters |
|---|---|
| 24,989 | Mother Candle high and major Monthly resistance. A breakout above this level would strengthen the long-term bullish outlook. |
| 24,356 | Weekly 50 EMA – Immediate resistance that buyers need to reclaim. |
| Daily 200 EMA & Descending Trendline | Current short-term resistance cluster and immediate decision zone. |
| 22,284 | Mother Candle low and major long-term support. |
| 22,276 | Weekly 200 EMA – Strong structural support if the market corrects further. |
Final Thoughts
This week’s Nifty 50 Technical Analysis highlights why analysing a single chart can often lead to incomplete conclusions. While the Daily chart focuses on the immediate battle between buyers and sellers, the Weekly chart provides insight into the strength of the ongoing recovery, and the Monthly chart continues to reinforce that the broader market structure remains constructive.
At present, all three timeframes point towards one important conclusion: Nifty is approaching a critical technical zone where the next decisive move could set the tone for the coming weeks.
As always, we’ll continue to monitor how price reacts around these levels and revisit the analysis in next week’s edition of our Nifty 50 Technical Analysis series.
While identifying opportunities is important, protecting your financial future through proper risk management is equally essential. Learn about insurane here
Frequently Asked Questions (FAQs)
1. What is Nifty 50 Technical Analysis?
Nifty 50 Technical Analysis is the process of studying the Nifty 50 price chart using technical indicators, price action, support and resistance levels, moving averages, and chart patterns to understand the market trend and identify potential trading opportunities.
2. Why is multi-timeframe analysis important in Nifty 50 Technical Analysis?
Multi-timeframe analysis helps investors view the market from different perspectives. The Monthly chart identifies the long-term trend, the Weekly chart shows medium-term momentum, and the Daily chart highlights short-term price action. Combining all three provides a more balanced view than relying on a single timeframe.
3. What does the current Monthly chart indicate for Nifty?
The Monthly chart continues to show a constructive long-term outlook. Nifty remains above its major moving averages and is consolidating within the Mother Candle range, suggesting that the broader bullish structure remains intact.
4. Why is the Weekly 50 EMA important?
The Weekly 50 EMA is currently acting as an important resistance level. A sustained move above it would indicate improving medium-term momentum and strengthen the bullish outlook.
5. Why is the Daily 200 EMA being closely watched?
The Daily 200 EMA coincides with a descending trendline, creating a significant resistance zone. How Nifty reacts around this level could influence the market’s short-term direction.
6. What is a Mother Candle?
A Mother Candle is a large candlestick whose high and low contain the price movement of the following candles. It generally indicates a period of consolidation before the market makes its next significant move.
7. Does this Nifty 50 Technical Analysis predict future market movements?
No. This Nifty 50 Technical Analysis is based on current chart structures and publicly available market data. It presents possible scenarios based on technical observations and should not be interpreted as a prediction or guarantee of future market performance.
8. How often is the Nifty 50 Technical Analysis published?
Our Nifty 50 Technical Analysis series is published weekly, reviewing the latest Monthly, Weekly, and Daily chart structures, key support and resistance levels, and important technical developments for the upcoming week.
Disclaimer
Disclaimer: This article is published solely for educational and informational purposes. The technical analysis presented is based on publicly available price charts and reflects our interpretation of market structure at the time of writing. It should not be considered investment advice, trading advice, financial advice, or a recommendation to buy, sell, or hold any security or financial instrument.
StockMarketMasala is not registered with the Securities and Exchange Board of India (SEBI) as an Investment Adviser (IA) or Research Analyst (RA). Readers should conduct their own research and consult a SEBI-registered Investment Adviser or a qualified financial professional before making any investment decisions.
Financial markets are subject to market risks, and past performance is not indicative of future results. While every effort has been made to ensure the accuracy of the information presented, StockMarketMasala does not guarantee its completeness, accuracy, or timeliness and shall not be liable for any losses arising from reliance on this content.
Check-out RBI’s Latest Monetary Policy
Checkout next week’s Nifty 50 Outlook: Published on 09/08/2026