

Nifty 50 Weekly Analysis: Trendline Break Hits the Gap Zone. What Next?
The Nifty 50 has reached an important technical juncture after last week’s warning on the rising trendline played out almost exactly as anticipated.
In our previous Nifty 50 analysis, we highlighted that the rising trendline had been tested multiple times and that repeated tests could weaken the support. We also identified the 23,891.55–23,823.60 gap zone as the next important area to watch if the trendline broke.
That is exactly what happened.
Nifty 50 broke below the rising trendline and moved toward the identified gap-fill zone. The index is now trading below its daily 50 EMA, while the weekly chart shows Nifty struggling around its 50-week EMA. At the same time, the broader monthly structure remains within the large mother candle range, keeping the longer-term picture from turning decisively bearish.
With Nifty now near a crucial support area, the next move could depend heavily on whether the index manages to stabilize and reclaim important moving averages or continues lower toward the next support levels.
Let’s look at the monthly, weekly and daily charts individually.
Last Week’s Nifty 50 Analysis vs What Actually Happened
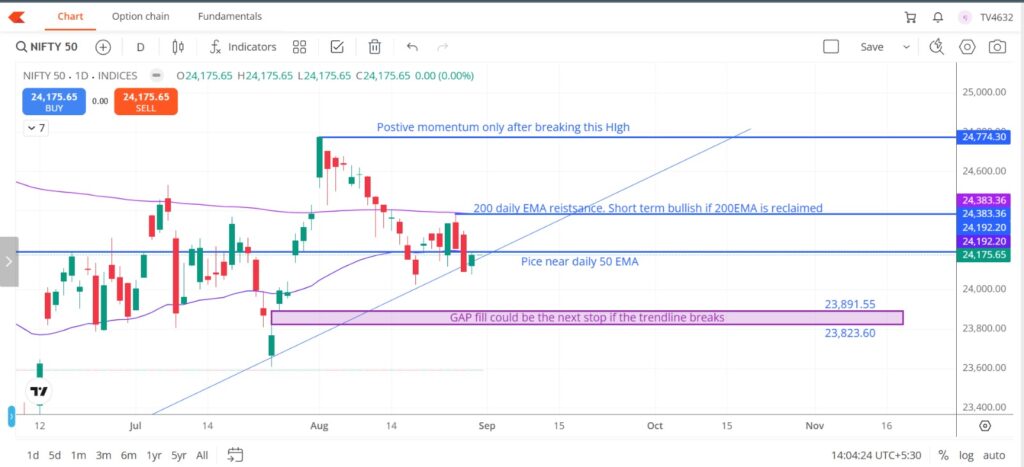
Before looking ahead, it is worth revisiting the setup from last week’s analysis.
The rising trendline had been supporting Nifty’s recovery from the April low. However, the index had already tested this trendline several times. As we highlighted last week, the more frequently a trendline is tested, the weaker that support can become.
We had specifically noted that a break of the trendline could open the door toward the 23,891.55–23,823.60 gap-fill zone.
The market subsequently confirmed that scenario. Nifty broke below the rising trendline and moved down toward the gap zone, making the previous week’s technical warning particularly important.
This is also a good reminder that technical analysis is not about predicting every move with certainty. Rather, it is about identifying important levels and understanding what could happen if those levels hold or fail.
The focus now shifts to whether the gap zone can provide support and whether Nifty can reclaim the moving averages that it has recently been struggling around.
Nifty 50 Monthly Analysis: Still Inside the Mother Candle Range
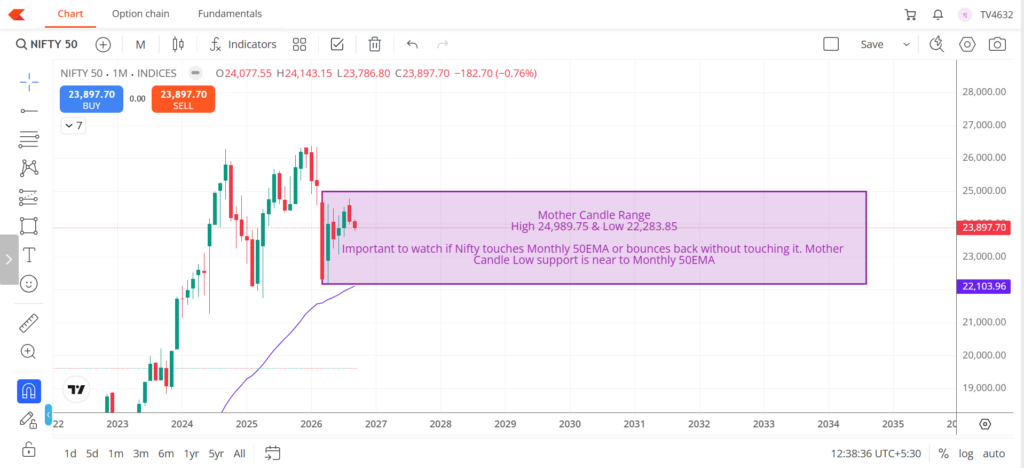
The monthly chart continues to show Nifty 50 trading inside the broad mother candle range, with the high at 24,989.75 and the low at 22,283.85.
The current level is around 23,897.70, which places Nifty in the lower-middle portion of this broader range.
The monthly chart is therefore still relatively neutral from a larger structural perspective. Nifty has not broken below the mother candle low, nor has it broken above the mother candle high. Until one of these boundaries is decisively breached, the broader range remains relevant.
One important level to watch on the monthly chart is the Monthly 50 EMA, currently around 22,103.96. The mother candle low at 22,283.85 is also relatively close to this moving average, creating an important longer-term support area.
The key question from the monthly timeframe is whether Nifty eventually moves toward the Monthly 50 EMA or manages to find support and recover before reaching it.
If Nifty stabilizes above the current levels and starts moving higher again, the broader mother candle range remains intact. However, a sustained breakdown below the lower portion of this range would weaken the longer-term structure considerably.
For now, the monthly chart suggests that the index is still consolidating within a larger range rather than being in a confirmed long-term breakdown.
Nifty 50 Weekly Analysis: Trendline Breakdown and 50 EMA Resistance
The weekly chart is where the recent deterioration becomes more visible.
Nifty 50 has broken below the rising trendline originating from the April low. This trendline had been an important part of the recovery structure, supporting the index on multiple occasions.
However, as we discussed in the previous analysis, repeated tests of the same trendline can weaken its ability to provide support. The eventual breakdown therefore needs to be taken seriously.
Nifty is now trading around 23,897.70, below the weekly 50 EMA at 24,316.88.
This moving average is important because Nifty has been moving around it in recent weeks. A sustained reclaim of the weekly 50 EMA, particularly with a strong bullish candle, would strengthen the recovery structure and suggest that the recent weakness could be a temporary correction.
For now, however, the index remains below this important resistance.
On the upside, 24,316.88 is therefore the first level to watch. If Nifty manages to reclaim the weekly 50 EMA and sustain above it, the recovery could regain momentum.
Above that, 24,774.30 remains the major upside trigger visible on the chart. A decisive break above this level would provide a stronger positive momentum signal.
On the downside, 23,645.35 is the next important level marked on the weekly chart if Nifty fails to reclaim the weekly 50 EMA.
Therefore, the weekly chart currently presents a clear battle between the 50 EMA on the upside and the support zone below.
Nifty 50 Daily Analysis: Gap Fill Reached After Trendline Breakdown
The daily chart provides the clearest confirmation of what played out from last week’s setup.
Nifty broke below the rising trendline that had been supporting the recovery from the April low. As highlighted previously, this trendline had already been tested multiple times, making the support progressively weaker.
Once the trendline gave way, Nifty moved toward the previously identified gap-fill zone between 23,891.55 and 23,823.60.
The index is now trading around 23,897.70, meaning it has reached the upper edge of this important zone.
This is a crucial area to watch because the market has now reached the level that was identified as the next potential destination following the trendline breakdown.
The daily chart also shows Nifty trading below the Daily 50 EMA at 24,140.74. The index needs to reclaim this moving average to improve the short-term structure.
A sustained move back above 24,140.74 would be the first indication that buyers are attempting to regain control. Above this, 24,383.36, the Daily 200 EMA, becomes the next important resistance.
A decisive reclaim of the Daily 200 EMA could strengthen the short-term bullish setup considerably.
However, if Nifty fails to sustain above the current gap-fill area and continues lower, 23,645.35 becomes the next important support level.
The rising trendline should also continue to be monitored even though it has already broken. The breakdown is significant because the trendline had been tested multiple times before eventually giving way.
This is exactly why repeatedly tested trendline support should not be treated as permanent support.
Key Nifty 50 Levels to Watch
| Level | Significance |
|---|---|
| 24,989.75 | Monthly Mother Candle High |
| 24,774.30 | Major upside momentum trigger |
| 24,383.36 | Daily 200 EMA resistance |
| 24,316.88 | Weekly 50 EMA |
| 24,140.74 | Daily 50 EMA |
| 23,891.55–23,823.60 | Gap-fill zone |
| 23,645.35 | Next support below gap zone |
| 22,283.85 | Monthly Mother Candle Low |
| 22,103.96 | Monthly 50 EMA |
Nifty 50 Bull Case
The bullish scenario begins with Nifty successfully holding the 23,891.55–23,823.60 gap-fill zone.
If buyers manage to defend this area and the index starts moving higher, the first important confirmation would be a reclaim of the Daily 50 EMA at 24,140.74.
A move above the Daily 50 EMA would bring 24,316.88, the Weekly 50 EMA, into focus. Reclaiming the weekly moving average would strengthen the recovery structure and suggest that the recent trendline breakdown may have been a correction rather than the beginning of a larger decline.
Above these levels, 24,774.30 remains the major upside trigger. A decisive break above this level could bring positive momentum back into the index and potentially open the way toward the 24,989.75 monthly mother candle high.
In short, the bullish sequence to watch is:
Gap zone holds → Daily 50 EMA reclaimed → Weekly 50 EMA reclaimed → 24,774.30 breaks → Monthly mother candle high comes into focus.
Nifty 50 Bear Case
The bearish scenario becomes stronger if Nifty fails to hold the current gap-fill zone.
A sustained move below 23,823.60 would indicate that the gap zone has failed to provide support. In that case, the next important level to watch would be 23,645.35.
The breakdown would become more concerning if Nifty continues to make lower highs and remains below the Daily 50 EMA and Weekly 50 EMA.
A deeper correction could then bring the lower portion of the monthly mother candle range into focus, with 22,283.85 acting as a major longer-term support.
The Monthly 50 EMA around 22,103.96 is also important because it sits close to the mother candle low.
Therefore, the bearish sequence is:
Gap zone fails → 23,645.35 breaks → deeper correction risk increases → Monthly mother candle low at 22,283.85 comes into focus.
What Should Traders Watch Next Week?
The coming week could be particularly important because Nifty is sitting near a previously identified support zone after breaking the rising trendline.
Rather than focusing on a single level, traders should watch how price behaves around the broader 23,823.60–24,140.74 area.
If Nifty holds the gap-fill zone and begins reclaiming the Daily 50 EMA, it would indicate that buyers are attempting to repair the short-term structure.
On the other hand, failure to hold the gap zone followed by a break of 23,645.35 would indicate that sellers remain in control and that the correction could deepen.
On the upside, 24,316.88 and 24,774.30 remain the important confirmation levels. A sustained move above these levels would materially improve the technical picture.
Conclusion
Last week’s Nifty 50 analysis highlighted a simple but important risk: the rising trendline had been tested multiple times, and another test could weaken the support enough for a breakdown.
That warning played out.
Nifty subsequently broke the trendline and moved toward the 23,891.55–23,823.60 gap-fill zone, exactly the area we had identified as the next potential destination if the trendline failed.
The index is now at a crucial point.
The monthly chart remains within the broader mother candle range, keeping the longer-term structure relatively neutral. The weekly chart, however, shows Nifty below its 50 EMA at 24,316.88, while the daily chart shows the index below the 50 EMA at 24,140.74 after the trendline breakdown.
For the bulls, holding the gap zone and reclaiming the Daily and Weekly 50 EMAs would be an encouraging sign. For the bears, a sustained breakdown below 23,823.60, followed by a move below 23,645.35, could open the door to a deeper correction.
The most important thing to remember is that levels matter more than predictions. The market will tell us which scenario is playing out through price action around these zones.
For now, 23,823.60 on the downside and 24,140.74–24,316.88 on the upside are the levels to watch closely in the coming week.
FAQs
1. What is the Nifty 50 weekly analysis for next week?
The Nifty 50 weekly analysis suggests that the index is at an important technical juncture after breaking its rising trendline and moving toward the 23,891.55–23,823.60 gap-fill zone. Holding this area and reclaiming key EMAs could improve the outlook, while a sustained breakdown could lead to further weakness.
2. What are the key Nifty 50 levels to watch next week?
The key levels are 23,891.55–23,823.60 on the downside, followed by 23,645.35. On the upside, 24,140.74, 24,316.88 and 24,774.30 are important levels to watch.
3. What happened to the Nifty 50 trendline?
Nifty 50 broke below the rising trendline that had been supporting the recovery from the April low. The trendline had been tested multiple times, and repeated tests can weaken a support level before it eventually breaks.
4. What is the Nifty 50 gap-fill zone?
The Nifty 50 gap-fill zone identified in the analysis is between 23,891.55 and 23,823.60. This area is important because it was identified as the potential next stop if the rising trendline support failed.
5. What is the Nifty 50 50-day EMA?
The Daily 50 EMA is around 24,140.74 based on the chart used for this analysis. Nifty is currently below this level, making it an important resistance level for the short-term structure.
6. What is the Nifty 50 50-week EMA?
The Weekly 50 EMA is around 24,316.88. A sustained reclaim of this moving average could strengthen the recovery structure, particularly if accompanied by a strong bullish candle.
7. What is the major resistance for Nifty 50?
The analysis identifies 24,774.30 as the major upside momentum trigger. A decisive break above this level could bring the monthly mother candle high of 24,989.75 into focus.
8. What is the next support for Nifty 50?
If the 23,891.55–23,823.60 gap-fill zone fails to hold, 23,645.35 is the next important support level highlighted in the analysis.
9. Is the Nifty 50 outlook bullish or bearish?
The current setup is mixed. The monthly chart remains within the broader mother candle range, while the weekly and daily charts show weakness following the trendline breakdown. The short-term outlook could improve if Nifty reclaims the Daily and Weekly 50 EMAs, while a sustained break below the current support zone would strengthen the bearish scenario.
10. What is the Nifty 50 bull case for next week?
The bull case involves Nifty holding the gap-fill zone, reclaiming the Daily 50 EMA at 24,140.74, moving above the Weekly 50 EMA at 24,316.88 and eventually breaking 24,774.30. Such price action would improve the recovery structure.
11. What is the Nifty 50 bear case for next week?
The bear case would strengthen if Nifty fails to hold 23,823.60 and subsequently breaks 23,645.35. A deeper correction could then bring the monthly mother candle low of 22,283.85 into focus.
12. Should traders rely only on Nifty 50 technical analysis?
No. Technical analysis can help identify trends, support, resistance and potential scenarios, but it cannot predict market movements with certainty. Traders and investors should also consider broader market conditions, risk management and their individual objectives.
For more insights beyond market analysis, explore our personal finance guides covering investing, money management and financial planning.
Disclaimer
Disclaimer: This Nifty 50 analysis is for educational and informational purposes only and should not be considered investment, trading, or financial advice. The technical levels, support and resistance zones, trendlines, moving averages, and market scenarios discussed are based on chart analysis and may change as market conditions evolve. Markets can be volatile, and past price action does not guarantee future results. Readers should conduct their own research, consider their risk tolerance and investment objectives, and consult a SEBI-registered financial advisor before making any investment or trading decisions. Stock Market Masala does not guarantee the accuracy or future outcome of any market view or scenario discussed in this article.
Looking to sharpen your technical analysis skills? Explore these recommended books and learning resources for understanding charts, indicators, and market trends.
Top Rates Books on Amazon:
Technical Analysis Made Easy: A Beginner to Advanced Guide to Price Action Trading
Technical Analysis of the Financial Markets