

Nifty 50 Weekly Analysis: 13th Sep 2026 Key Levels
The Nifty 50 weekly analysis enters another important phase after the index failed to hold the support zone highlighted in last week’s setup. In our previous analysis, we identified the 23,891.55–23,823.60 gap zone as a crucial area after the rising trendline had already broken. We also highlighted 23,645.35 as the next important support if the gap zone failed.
That support eventually gave way as selling pressure intensified. Nifty closed the week at 23,398.10, down around 2.09% for the week, extending its losing streak to five consecutive weeks. The index also closed close to the lower end of its weekly range, reflecting continued weakness.
The immediate question for this week’s Nifty 50 weekly analysis is therefore no longer whether the earlier trendline will hold. That setup has already played out. The focus has now shifted to whether Nifty can defend the next layer of support around 23,070, or whether the correction could extend toward the much stronger 22,000–22,500 support cluster.
Last Week’s Nifty 50 Analysis vs What Actually Happened
Last week’s analysis highlighted the 23,891.55–23,823.60 gap-fill zone as an important support area. Nifty had already broken the rising trendline, and the expectation was that this gap zone could determine whether the index stabilised or continued its correction.
The market ultimately failed to establish a sustained recovery from that area. Instead, selling pressure continued, and Nifty moved below the 23,645.35 support that we had identified as the next level to watch if the gap zone failed.
The index eventually closed at 23,398.10, meaning the market has now moved considerably lower than the levels discussed in the previous week’s Nifty 50 weekly analysis.
This is an important shift in the technical picture. The previous week’s gap zone and 23,645 support are no longer the primary levels to focus on. Traders now need to watch the fresh support levels visible on the Daily, Weekly and Monthly charts.
The broader market environment has also remained challenging. Nifty recorded its fifth consecutive weekly decline, with rising crude oil prices, geopolitical uncertainty and higher global bond yields adding to the pressure on Indian equities. Reuters reported that Brent crude moved above $100 a barrel during the week, while 14 of 16 major sectors recorded weekly losses.
Nifty 50 Monthly Analysis
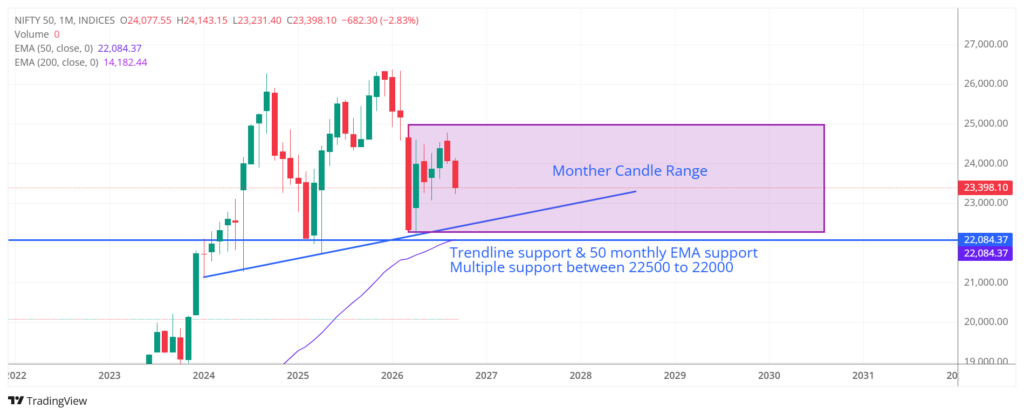
The monthly chart continues to provide an important perspective because, despite the recent correction, Nifty is still trading within the broader monthly mother candle range.
The mother candle range remains approximately 22,283.85 to 24,989.75. This is an important longer-term range because it continues to contain the index’s price action.
At the current level of 23,398.10, Nifty is still comfortably above the lower end of this range. However, the index is moving closer to the more important monthly support zone.
The Monthly 50 EMA is currently around 22,084.37. This is particularly important because the lower portion of the monthly mother candle range, the Monthly 50 EMA and the rising longer-term trendline create a significant area of potential support.
In other words, the monthly chart does not suggest that the entire long-term structure has broken down yet. Instead, it shows that Nifty is approaching a major decision zone.
Monthly levels to watch
The 22,283.85 mother candle low is an important level.
Below that, the 22,084.37 Monthly 50 EMA becomes important.
This creates a broader support region of approximately 22,000–22,300, with the larger monthly structure becoming increasingly important if selling pressure continues.
On the upside, the 24,989.75 mother candle high remains the major monthly resistance.
Therefore, the monthly Nifty 50 weekly analysis suggests that the current correction is approaching a much more important long-term support area, but that area has not yet been tested.
Nifty 50 Weekly Analysis
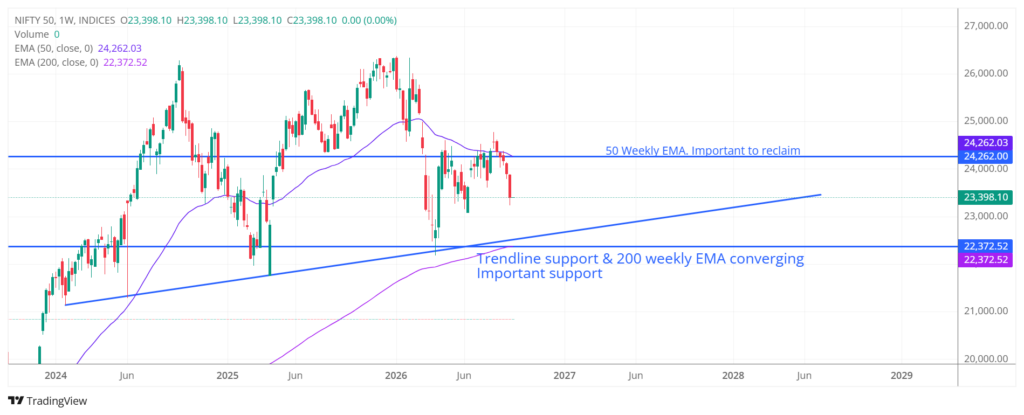
The weekly chart currently provides a more cautious picture.
Nifty is trading at 23,398.10, while the Weekly 50 EMA is around 24,262.03. The index is therefore well below this important moving average.
The Weekly 50 EMA is now a key recovery level. A bounce from lower levels by itself would not necessarily signal a trend reversal. Nifty would need to reclaim and sustain above this moving average to demonstrate that bullish momentum is returning.
More importantly, the Weekly 200 EMA is currently around 22,372.52.
The weekly chart also shows a rising trendline approaching this area. This creates an important convergence between the Weekly 200 EMA and the rising weekly trendline.
That makes the 22,300–22,400 region one of the most important support areas on the current chart.
This is considerably more important than the 23,645 level discussed in last week’s article because it represents a confluence of technical factors rather than a single horizontal support.
If Nifty reaches this region, the reaction from this support could provide an important clue about whether the current decline is simply a deeper correction or the beginning of a larger structural breakdown.
Nifty 50 Daily Analysis
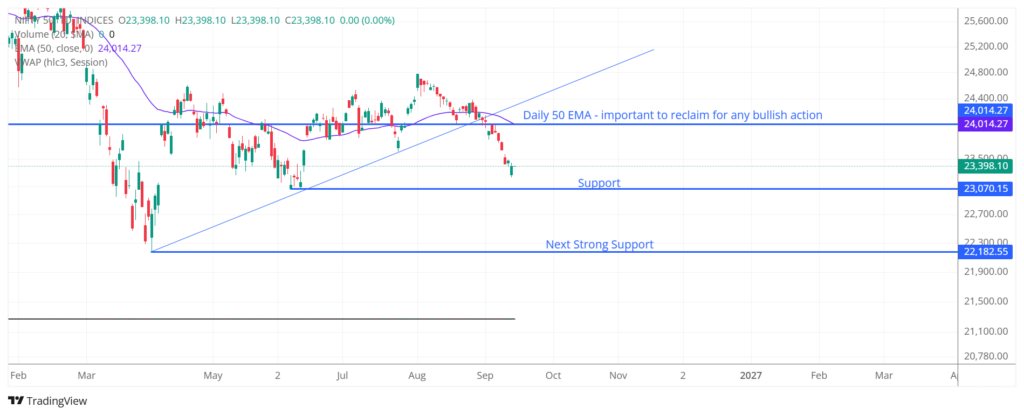
The Daily chart currently shows the clearest evidence of short-term weakness.
Nifty is trading at 23,398.10, while the Daily 50 EMA is around 24,014.27.
The index therefore remains below its Daily 50 EMA, which is now an important level for any meaningful short-term recovery.
The previous rising trendline visible on the Daily chart has already been broken. Therefore, that trendline should no longer be treated as active support.
The immediate support visible on the current Daily chart is 23,070.15.
This is the first level traders should watch closely.
A successful defence of 23,070 could lead to a short-term bounce. However, the bounce would need to reclaim the Daily 50 EMA around 24,014 to improve the short-term structure meaningfully.
Below 23,070, the next important support shown on the chart is around 22,182.55.
This level becomes particularly interesting because it sits close to the larger weekly and monthly support cluster.
Therefore, the Daily chart is currently presenting a relatively simple framework:
23,070 → immediate support
22,182 → next strong support
24,014 → Daily 50 EMA and first important recovery level
Key Nifty 50 Levels to Watch
| Level | Importance | What to Watch |
|---|---|---|
| 24,989.75 | Monthly resistance | Mother candle high |
| 24,262.03 | Weekly resistance | Weekly 50 EMA |
| 24,014.27 | Daily resistance | Daily 50 EMA |
| 23,398.10 | Current level | Nifty closing level |
| 23,070.15 | Immediate support | Important Daily support |
| 22,372.52 | Major support | Weekly 200 EMA |
| 22,283.85 | Major support | Monthly mother candle low |
| 22,182.55 | Strong support | Daily chart support |
| 22,084.37 | Major support | Monthly 50 EMA |
The key takeaway from this Nifty 50 weekly analysis is that the levels are now forming two broad zones rather than isolated numbers.
The first is the 23,070 area, which represents immediate support.
The second is the much more important 22,000–22,400 region, where the Daily, Weekly and Monthly charts show multiple layers of support.
Nifty 50 Bull Case
The bullish scenario begins with Nifty successfully defending 23,070.15.
If buyers manage to hold this level and the index starts forming a higher low on the Daily chart, a short-term recovery could develop.
However, the first meaningful confirmation would come only when Nifty reclaims the Daily 50 EMA around 24,014.27.
Above that, the Weekly 50 EMA around 24,262.03 becomes the next important hurdle.
A sustained move above both moving averages would significantly improve the short-term technical structure and could indicate that the current correction is losing momentum.
The larger bullish structure would become more convincing only if Nifty eventually moves toward and breaks the upper portion of the monthly mother candle range, particularly 24,989.75.
For now, however, the bullish case should be treated as a potential recovery scenario rather than a confirmed reversal.
Nifty 50 Bear Case
The bearish scenario becomes stronger if Nifty fails to hold 23,070.15.
A decisive breakdown below this level could expose the index to the next strong support around 22,182.55.
This region is particularly important because it sits close to several other major support indicators.
The Weekly 200 EMA at 22,372.52, the Monthly mother candle low at 22,283.85, the Daily support around 22,182.55, and the Monthly 50 EMA at 22,084.37 collectively create a substantial support cluster.
Therefore, the 22,000–22,400 region could become the biggest test for Nifty if the correction continues.
A sustained breakdown below this entire zone would be considerably more concerning because it would mean that multiple timeframe supports have failed simultaneously.
Until that happens, however, it is important not to assume that the long-term structure has already turned decisively bearish.
What Should Traders Watch Next Week?
The next week could be particularly important because Nifty is approaching a fresh decision point after breaking below the support levels discussed in last week’s Nifty 50 weekly analysis.
1. Can Nifty hold 23,070?
This is the first question.
A successful defence could result in a short-term bounce, while a decisive breakdown could open the door toward the 22,000–22,400 support region.
2. Can Nifty reclaim the Daily 50 EMA?
The 24,014.27 Daily 50 EMA is the first important level bulls need to reclaim.
Without a sustained move above this level, rallies could continue to face selling pressure.
3. Watch 22,300–22,400 closely
If the correction continues, the Weekly 200 EMA around 22,372.52 and the nearby weekly trendline could become extremely important.
This is potentially the strongest technical support area on the current Weekly chart.
4. Watch the monthly support cluster
The 22,283.85 mother candle low and 22,084.37 Monthly 50 EMA are important longer-term levels.
A reaction from this region could determine whether the broader monthly structure remains intact.
5. Don’t ignore the macro backdrop
Technical levels remain the primary focus of this Nifty 50 weekly analysis, but the recent decline has also occurred alongside a challenging macro environment.
Rising crude oil prices, geopolitical tensions and concerns around global interest rates have added pressure to Indian equities. Reuters reported that Nifty fell for a fifth consecutive week, with the index down more than 2% over the week.
That means traders should be prepared for higher volatility around important technical levels rather than assuming that every support will automatically produce a sustained bounce.
Nifty 50 Weekly Analysis: What Comes Next?
The Nifty 50 technical picture has weakened further compared with last week’s setup.
The 23,891.55–23,823.60 gap zone identified in the previous analysis failed to produce a meaningful recovery, and the subsequent break below 23,645.35 brought the index down to 23,398.10.
The immediate focus now shifts to 23,070.15.
If this level holds, Nifty could attempt a recovery toward the Daily 50 EMA at 24,014.27 and eventually the Weekly 50 EMA at 24,262.03.
If 23,070 breaks decisively, the focus could shift toward the 22,000–22,400 region, where the Weekly 200 EMA, Weekly trendline, Monthly mother candle low and Monthly 50 EMA create a much stronger multi-timeframe support zone.
Therefore, the most important takeaway from this week’s Nifty 50 weekly analysis is that 23,070 is the immediate line in the sand, while 22,000–22,400 is the bigger structural support zone.
Until Nifty reclaims the Daily and Weekly 50 EMAs, rallies should be viewed cautiously. At the same time, the long-term structure should not be considered decisively broken unless the major monthly support zone also fails.
FAQs
What is the Nifty 50 weekly analysis for next week?
The current Nifty 50 weekly analysis shows a weak short-term structure after the index fell below the gap zone and the 23,645 support discussed last week. The immediate support to watch is 23,070.15, while the larger support zone is around 22,000–22,400.
What are the key Nifty 50 levels to watch next week?
The immediate support is 23,070.15. Below that, traders should watch the 22,182–22,400 region, while 24,014 and 24,262 are important recovery levels corresponding to the Daily and Weekly 50 EMAs.
What happened to the Nifty 50 trendline?
The rising Daily trendline had already broken before last week’s analysis and therefore is no longer being treated as active support. The current Weekly chart has a separate rising trendline that is approaching the 22,300–22,400 region and could become important if the correction extends.
What is the Nifty 50 gap-fill zone?
The 23,891.55–23,823.60 gap zone was the important support area identified in the previous week’s analysis. Nifty subsequently failed to sustain that area and moved lower, making the 23,070 level the next immediate support.
What is the Nifty 50 50-day EMA?
The Daily 50 EMA is currently around 24,014.27. It is an important short-term recovery level because Nifty is currently trading below it.
What is the Nifty 50 50-week EMA?
The Weekly 50 EMA is currently around 24,262.03. A sustained reclaim of this level would improve the weekly technical structure and provide stronger evidence of recovery.
What is the major resistance for Nifty 50?
The first important resistance is the Daily 50 EMA around 24,014.27, followed by the Weekly 50 EMA around 24,262.03. The larger monthly resistance is the mother candle high at 24,989.75.
What is the next support for Nifty 50?
The immediate support is 23,070.15. If that fails, the next major area to watch is approximately 22,000–22,400, where several technical indicators converge.
Is the Nifty 50 outlook bullish or bearish?
The short-term technical structure is currently bearish because Nifty remains below its Daily and Weekly 50 EMAs and has broken several recent support levels. However, the longer-term structure has not decisively broken because the index remains above the major monthly support zone.
What is the Nifty 50 bull case for next week?
The bull case begins with Nifty holding 23,070 and forming a higher low. A reclaim of 24,014, followed by 24,262, would provide progressively stronger evidence that the correction is losing momentum.
What is the Nifty 50 bear case for next week?
The bear case strengthens if Nifty decisively breaks below 23,070. That could expose the index to the 22,182–22,400 area and potentially the broader 22,000–22,300 monthly support zone.
Should traders rely only on Nifty 50 technical analysis?
No. Technical analysis helps identify price levels, trends and potential scenarios, but it cannot predict market movements with certainty. Traders should also consider market conditions, global events, crude oil prices, economic data, volatility and their own risk management.
Disclaimer
Disclaimer: This Nifty 50 analysis is for educational and informational purposes only. It is based on technical charts, price action, moving averages, support/resistance levels and other market observations available at the time of writing. Technical analysis does not guarantee future price movements, and markets can move unpredictably due to economic data, global events, news, institutional flows and other factors. This article should not be considered investment advice or a recommendation to buy, sell or hold any security. Readers should conduct their own research and consider their risk tolerance and financial objectives before making any investment decision. Readers should conduct their own research, consider their risk tolerance and investment objectives, and consult a SEBI-registered financial advisor before making any investment or trading decisions.