
Nifty 50 Weekly Outlook: 26th Jul 2026 Key Levels
Last Updated: July 26, 2026
The Nifty 50 ended the week on a weaker note after facing resistance near an important technical level, signaling that bullish momentum has slowed in the short term. While the broader market structure remains constructive on the monthly chart, both the weekly and daily timeframes indicate that the index is currently under pressure.
Our Nifty 50 analysis of the monthly, weekly, and daily charts suggests that the market is entering an important phase where price action around key support and resistance levels could shape the next directional move. Although long-term investors may still find comfort in the broader uptrend, short-term participants should closely monitor whether the index can stabilize above nearby support zones.
In this week’s multi-timeframe analysis, we examine what the charts are indicating, explain the significance of major technical levels, and highlight what investors should watch in the coming week.
Market Structure Meter
| Timeframe | Trend | Market Structure |
|---|---|---|
| Monthly | 🟢 Bullish | Long-term trend remains intact despite consolidation. |
| Weekly | 🟡 Neutral to Weak | Momentum has weakened after rejection from the Weekly 50 EMA. |
| Daily | 🔴 Bearish | Short-term selling pressure remains visible below key moving averages. |
The Market Structure Meter provides a quick overview of how the index is behaving across different timeframes. While the monthly chart continues to support a positive long-term outlook, the shorter timeframes suggest caution as sellers currently have the upper hand.
Key Takeaways
- The long-term trend remains positive despite recent weakness.
- Nifty continues to trade within a major monthly consolidation range.
- The Weekly 50 EMA is acting as an important resistance level.
- Short-term momentum remains weak after the index slipped below the Daily 50 EMA.
- Immediate support zones will be closely watched over the coming sessions.
Nifty 50 Monthly Timeframe Analysis
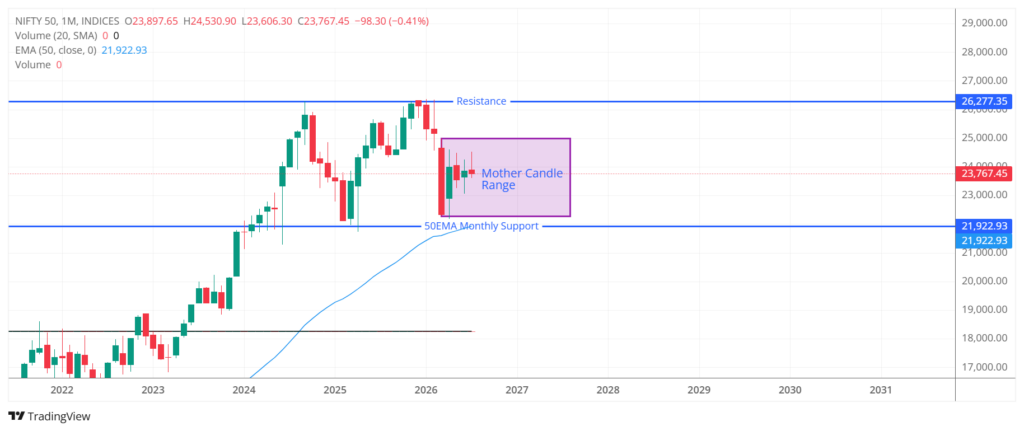
From a long-term perspective, the Nifty 50 continues to maintain a constructive market structure despite recent consolidation.
One of the most notable observations on the monthly chart is that the index remains within the range of a large Mother Candle, indicating that the market has entered a period of consolidation rather than a confirmed trend reversal. Such consolidation phases often represent a balance between buyers and sellers before a decisive move develops.
Although recent months have lacked strong directional momentum, the broader trend continues to favor the bulls as long as major long-term support levels remain intact.
The primary resistance on the monthly timeframe is located around 26,277, which marks the upper boundary of the current consolidation structure. A sustained move above this level would indicate renewed strength and confirm that buyers have regained control.
On the downside, the 50-month Exponential Moving Average (EMA), currently positioned near 21,923, continues to act as a major long-term support. This moving average has historically provided support during broader market corrections and remains an important level for long-term investors.
At present, our analysis suggests that the monthly chart remains constructive but is waiting for a decisive breakout from its current range before establishing the next major trend.
Nifty 50 Weekly Timeframe Analysis
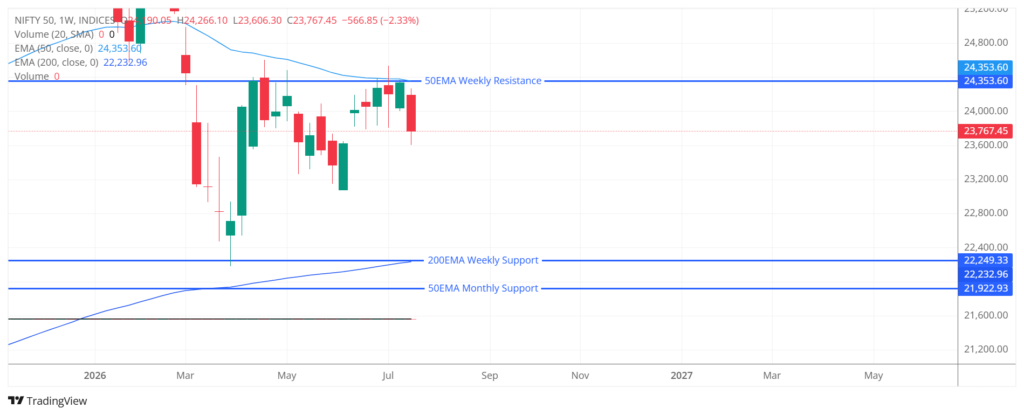
The weekly chart paints a more cautious picture compared to the monthly timeframe.
After attempting to move higher, the Nifty faced rejection near the Weekly 50 EMA, currently positioned around 24,354. This rejection indicates that buyers were unable to sustain upward momentum, allowing sellers to regain control during the week.
Price is currently trading below this moving average, making it an important resistance level in the near term.
Although this rejection weakens the short-term outlook, it does not necessarily invalidate the broader long-term trend. Instead, it suggests that the market is currently undergoing a healthy corrective phase within a larger uptrend.
Another important observation is the location of the Weekly 200 EMA, which lies around 22,233. This level closely aligns with the Monthly 50 EMA, creating a significant technical support zone. When multiple moving averages from different timeframes converge near the same price area, technicians often consider it a stronger support region because it attracts attention from different groups of market participants.
As long as this broader support zone remains intact, the long-term market structure continues to favor higher levels over an extended period, even if short-term volatility persists.
Nifty 50 Daily Timeframe Analysis
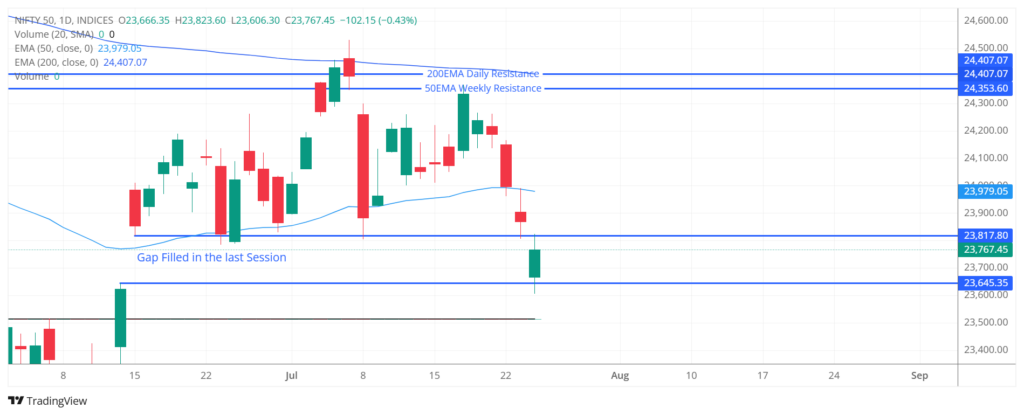
The daily chart reflects the weakest structure among the three timeframes.
Recent price action indicates increasing selling pressure after the index failed to sustain higher levels. The market has already filled the previous price gap and subsequently moved below the Daily 50 EMA, which currently stands near 23,979.
Trading below the Daily 50 EMA often suggests weakening short-term momentum, although it does not by itself confirm a change in the broader trend.
The chart also shows a sequence of bearish candles, indicating that sellers have maintained control over recent sessions. Until buyers demonstrate renewed strength, market sentiment on the daily timeframe is likely to remain cautious.
On the upside, the region between 24,354 and 24,407 represents a significant resistance zone as it combines the Weekly 50 EMA and the Daily 200 EMA. Markets often struggle near such areas because multiple technical indicators converge at similar price levels.
For the coming week, this zone is likely to remain one of the most closely watched areas on the chart.
Nifty 50 Key Support & Resistance Levels
| Level | Price | Why It Matters |
|---|---|---|
| Major Resistance | 26,277 | Monthly resistance and upper consolidation boundary |
| Resistance Zone | 24,354 – 24,407 | Weekly 50 EMA and Daily 200 EMA |
| Major Support | 22,233 | Weekly 200 EMA |
| Long-Term Support | 21,923 | Monthly 50 EMA |
Technical Terms Explained
What Is an EMA?
An Exponential Moving Average (EMA) is a moving average that places greater weight on recent prices, making it more responsive to current market movements than a simple moving average. Traders and investors often use EMAs to identify trends as well as potential support and resistance levels.
What Is a Mother Candle?
A Mother Candle is a large candlestick whose high and low contain the price movement of one or more subsequent candles. This pattern often represents a period of consolidation where the market pauses before deciding its next significant direction.
What We’re Watching Next Week
Our Nifty 50 analysis suggests that the coming week could be important for determining whether the recent weakness remains a short-term correction or develops into a deeper pullback.
The market will likely continue to monitor whether Nifty 50 can stabilize above its immediate support levels while also observing if buyers can regain control near the Weekly 50 EMA.
From a broader perspective, Nifty 50 monthly structure continues to support a positive long-term outlook. However, until the index reclaims important resistance levels or establishes stronger buying momentum, investors should remain aware that short-term volatility may continue.
Rather than focusing on daily fluctuations, market participants should pay close attention to how price behaves around the major support and resistance zones identified across multiple timeframes.
Conclusion
The Nifty 50 weekly outlook currently presents a mixed technical picture.
The monthly chart continues to indicate that the long-term trend remains healthy despite ongoing consolidation. The weekly chart shows that bullish momentum has weakened following rejection near the Weekly 50 EMA, while the daily chart reflects continued short-term selling pressure below key moving averages.
Although the shorter timeframes suggest caution, the broader market structure has not yet shown signs of a confirmed long-term reversal. The coming sessions will therefore be important in determining whether buyers can regain momentum or whether the market enters a deeper corrective phase.
For long-term investors, maintaining focus on the broader market structure rather than short-term price fluctuations remains essential. Meanwhile, traders and market participants should continue monitoring key technical levels, as these often provide valuable insight into evolving market sentiment.
Frequently Asked Questions (FAQs)
1. What is the Nifty 50 Weekly Outlook?
The Nifty 50 Weekly Outlook is a technical analysis of the Nifty 50 index based on monthly, weekly, and daily price charts. It highlights the current market structure, key support and resistance levels, and important trends that investors and traders should monitor in the coming week.
2. Why are support and resistance levels important in Nifty 50 analysis?
Support and resistance levels help identify price zones where buying or selling pressure may increase. Support is a level where demand may prevent further declines, while resistance is an area where selling pressure may limit further gains. These levels are widely used in Nifty 50 technical analysis to understand market sentiment.
3. What does the Market Structure Meter indicate?
The Market Structure Meter summarizes the overall trend across three different timeframes:
- Monthly: Long-term market direction
- Weekly: Medium-term trend
- Daily: Short-term momentum
This provides readers with a quick overview of whether the broader market is bullish, bearish, or neutral.
4. Why do you analyze the monthly, weekly, and daily charts together?
Each timeframe provides a different perspective on the market. The monthly chart helps identify the long-term trend, the weekly chart shows medium-term momentum, and the daily chart reflects short-term price action. Combining all three offers a more balanced view of the market than relying on a single timeframe.
5. What is an Exponential Moving Average (EMA)?
An Exponential Moving Average (EMA) is a technical indicator that gives greater weight to recent prices, making it more responsive to current market movements than a simple moving average. EMAs are commonly used to identify trends and potential support or resistance levels.
6. Does the Nifty 50 Weekly Outlook provide investment advice?
No. The Nifty 50 Weekly Outlook is published solely for educational and informational purposes. It reflects our interpretation of publicly available market data and should not be considered investment, financial, or trading advice.
7. How often is the Nifty 50 Weekly Outlook published?
The Nifty 50 Weekly Outlook is published once every week after the weekly market close. Each article reviews the latest price action, market structure, and important technical levels to watch for the upcoming week.
8. Where can I track the latest Nifty 50 levels and market updates?
You can follow our Nifty 50 Weekly Outlook series on StockMarketMasala for regular technical analysis, educational market insights, and updates on key support and resistance levels. For live market data, investors can also refer to the official NSE website.
Disclaimer: The information provided in this article is intended solely for educational and informational purposes and reflects our interpretation of publicly available market data at the time of publication. It should not be construed as investment advice, trading advice, financial advice, or a recommendation to buy, sell, or hold any security, index, or financial instrument.
StockMarketMasala is not registered with the Securities and Exchange Board of India (SEBI) as an Investment Adviser (IA) or Research Analyst (RA). The views expressed are general market commentary and are not tailored to the investment objectives, financial situation, or risk profile of any individual.
Financial markets are subject to market risks, and past performance is not indicative of future results. Readers should conduct their own research and consult a SEBI-registered Investment Adviser or other qualified financial professional before making any investment decisions.
While every effort is made to ensure the accuracy of the information presented, StockMarketMasala does not guarantee the completeness, accuracy, or timeliness of any information and shall not be liable for any losses arising from reliance on this content.
Learn More – Stock Market Basics