

Nifty 50 Weekly Analysis: 5 Crucial Levels as Mother Candle Sets the Next Move
The Nifty 50 weekly analysis enters another important week with the index still under pressure, but with an interesting development on the Daily chart. After last week’s analysis highlighted 23,070.15 as the immediate support, Nifty moved lower during the week but managed to hold above that level. The index eventually closed at 23,346.40, recording a relatively small weekly decline of around 0.22% and extending its losing streak to six weeks.
The important development now is the formation of a Daily mother candle. This candle has created a defined range, and the direction of the eventual breakout or breakdown could provide the next short-term signal for Nifty.
The bigger question for this week’s Nifty 50 weekly analysis is therefore straightforward: will Nifty break above the Daily mother candle and attempt a recovery, or will it break below the mother candle low and put the 23,070 support back under pressure?
Last Week’s Nifty 50 Analysis vs What Actually Happened
In last week’s Nifty 50 weekly analysis, we highlighted 23,070.15 as the immediate support to watch. The index had already weakened considerably from the levels discussed in the earlier analysis, and the key question was whether this support would hold.
Nifty did test the lower part of this area during the week. However, the index did not decisively break 23,070.15. Instead, buyers appeared around the support zone and Nifty recovered toward the 23,300–23,350 area.
The weekly data confirms that Nifty closed at 23,346.40 on September 18, compared with 23,398.10 on September 11. That translates into a weekly decline of roughly 0.22%.
So, compared with last week’s setup, one important thing actually went in favour of the support case: 23,070.15 held.
However, the recovery has not yet changed the broader technical structure. Nifty remains below the important Daily and Weekly 50 EMAs, meaning the market has stabilised near support but has not yet produced a confirmed recovery.
This is where the newly formed Daily mother candle becomes important.
Nifty 50 Monthly Analysis
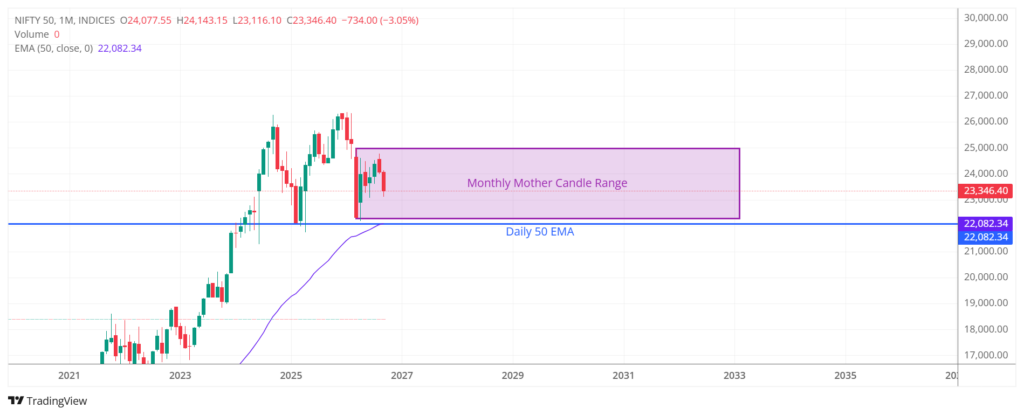
The Monthly chart continues to show Nifty trading inside the broader Monthly Mother Candle Range.
The current Nifty level is around 23,346.40, while the Monthly 50 EMA is at approximately 22,082.34.
The Monthly Mother Candle Range remains the larger structure within which Nifty is trading. The upper boundary is around 24,989.75, while the lower portion of the range sits close to the 22,000–22,300 region.
This means the current correction has moved Nifty considerably lower from the upper portion of the monthly range, but the index is still above the longer-term support represented by the Monthly 50 EMA.
The 22,082.34 Monthly 50 EMA therefore remains an important longer-term level.
If the correction extends significantly, the area around 22,000–22,300 becomes increasingly important because it represents the lower part of the Monthly Mother Candle Range and the vicinity of the Monthly 50 EMA.
For the moment, however, the Monthly chart is more useful for identifying the larger support and resistance framework than the immediate direction of the next move.
Nifty 50 Weekly Analysis
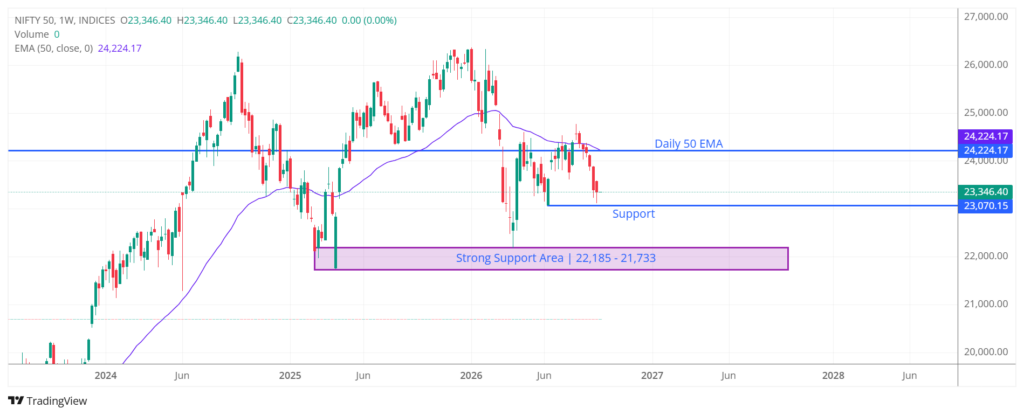
The Weekly chart continues to show a weak structure.
Nifty is currently around 23,346.40, while the Weekly 50 EMA stands at 24,224.17.
This is an important level because Nifty has remained below the Weekly 50 EMA during the recent decline. Therefore, any meaningful recovery would need to eventually reclaim this moving average.
The Weekly chart also shows a significant strong support area between approximately 22,185 and 21,733.
This is important because it gives us a clear lower support zone if the current support around 23,070 eventually fails.
Therefore, the Weekly chart can currently be divided into three broad areas:
- Above 24,224: stronger recovery territory
- 23,070–24,224: current range where Nifty needs to establish direction
- 22,185–21,733: major Weekly support area
The most important point is that 23,070 continues to hold on the Weekly structure, but Nifty has not yet reclaimed the Weekly 50 EMA.
That keeps the broader Weekly setup cautious.
Nifty 50 Daily Analysis: The Mother Candle Is Now the Key
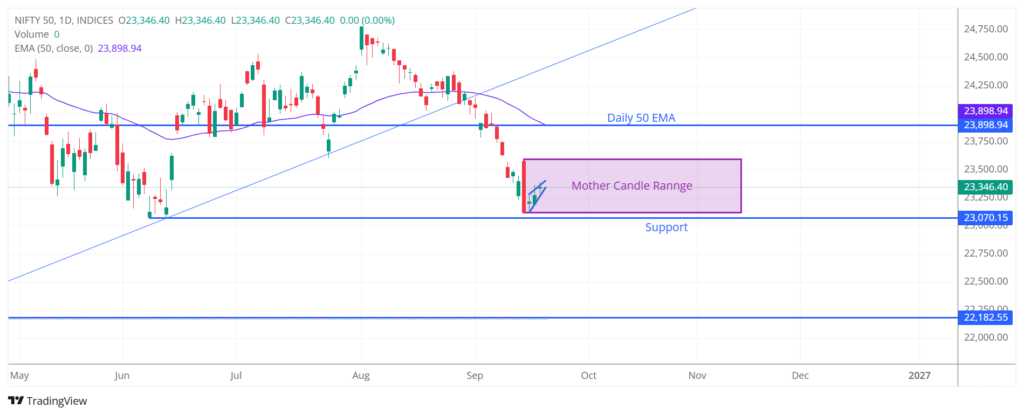
The Daily chart is where the most interesting development has occurred this week.
Nifty has formed a Daily Mother Candle, creating a clearly defined trading range. Based on the current chart, the mother candle’s range is approximately 23,118.60 to 23,592.85.
This range is important because the market could use the breakout or breakdown of this candle to establish the next short-term direction.
Why is the mother candle important?
A mother candle represents a relatively wide trading range compared with the candles that follow it. When subsequent price action remains inside that range, the market is effectively consolidating.
The eventual break from the range can therefore provide an important directional signal.
For Nifty, the two levels to watch are approximately:
Mother candle high: 23,592.85
Mother candle low: 23,118.60
A sustained move above the mother candle high would indicate that buyers are attempting to take control of the immediate structure.
On the other hand, a break below the mother candle low would be an important warning sign.
What Happens If the Daily Mother Candle Breaks Down?
This is particularly important because the mother candle low is relatively close to the 23,070.15 support highlighted in last week’s analysis.
The mother candle low is around 23,118.60, while the major support is at 23,070.15.
That means there is only a relatively small gap between these two levels.
If Nifty breaks below the mother candle low and subsequently breaks 23,070.15, the current support structure would weaken significantly.
In that scenario, the market could start moving toward the next major support area identified on the Weekly chart, around 22,185–21,733.
This is why the mother candle is particularly important this week. A breakdown is not simply a break of one Daily candle; it could also become the trigger for a test of the support that held during the previous week.
Nifty 50 50-Day EMA Remains the First Bullish Trigger
The Daily 50 EMA is currently at 23,898.94.
This remains the most important level for any meaningful bullish development in the short-term structure.
Nifty is currently trading below it by more than 500 points. Therefore, even if the index breaks above the Daily mother candle, there would still be another important hurdle near 23,899.
The sequence to watch is therefore:
Mother candle breakout → 23,592.85
followed by
Daily 50 EMA → 23,898.94
A sustained reclaim of the Daily 50 EMA would provide a stronger indication that the short-term structure is improving.
Until that happens, a move higher from the mother candle should be treated as a recovery attempt rather than confirmation of a larger trend change.
Key Nifty 50 Levels to Watch
| Level | Importance | What to Watch |
|---|---|---|
| 24,224.17 | Weekly resistance | Weekly 50 EMA |
| 23,898.94 | Daily resistance | Daily 50 EMA |
| 23,592.85 | Immediate resistance | Daily mother candle high |
| 23,346.40 | Current level | Nifty closing level |
| 23,118.60 | Immediate trigger | Daily mother candle low |
| 23,070.15 | Major immediate support | Support highlighted last week |
| 22,185 | Major support | Upper end of Weekly strong support area |
| 21,733 | Major support | Lower end of Weekly strong support area |
| 22,082.34 | Monthly support | Monthly 50 EMA |
The key takeaway from this week’s Nifty 50 weekly analysis is that 23,592.85 and 23,118.60 are now the immediate Daily mother candle boundaries, while 23,070.15 remains the critical support below them.
Nifty 50 Bull Case
The first bullish development would be a sustained breakout above the Daily mother candle high around 23,592.85.
That would indicate that buyers have managed to move Nifty out of the immediate consolidation range.
However, the next and more important hurdle would be the Daily 50 EMA at 23,898.94.
A sustained reclaim of the Daily 50 EMA would provide a stronger bullish signal and could bring the Weekly 50 EMA at 24,224.17 into focus.
Therefore, the bullish sequence is relatively clear:
23,592.85 → 23,898.94 → 24,224.17
The market would need to progressively reclaim these levels for the recovery to strengthen.
Nifty 50 Bear Case
The bearish setup begins if Nifty breaks below the Daily mother candle low around 23,118.60.
That would be the first indication that sellers are gaining control of the newly formed Daily structure.
However, the more important level would remain 23,070.15, because that is the support Nifty successfully defended during the previous week.
If the mother candle low breaks and Nifty subsequently breaks 23,070.15 decisively, the possibility of a move toward the 22,185–21,733 Weekly support zone increases.
This area would then become the next major test for the index.
The Monthly chart also becomes increasingly relevant around the 22,000–22,300 region, particularly because the Monthly 50 EMA is currently around 22,082.34.
What Should Traders Watch Next Week?
1. The Daily Mother Candle
This is the most immediate development.
The 23,118.60–23,592.85 range should be watched closely. A sustained breakout or breakdown could provide the next directional clue.
2. 23,070.15 Support
This level already held during the previous week.
If the mother candle breaks down, traders should pay particular attention to whether 23,070.15 continues to hold.
A break below both levels would materially change the short-term setup.
3. Daily 50 EMA at 23,898.94
For any meaningful bullish signal, Nifty needs to reclaim the Daily 50 EMA.
Until then, the index remains below an important short-term trend indicator.
4. Weekly 50 EMA at 24,224.17
Even if Nifty reclaims the Daily 50 EMA, the Weekly 50 EMA remains an important higher-timeframe hurdle.
A move toward this level would represent a more significant recovery from the current price.
5. 22,185–21,733 Support Area
If 23,070 fails, this is the next major Weekly support area shown on the chart.
The reaction from this zone could become important for understanding whether the correction is finding stronger longer-term support.
Nifty 50 Weekly Analysis: What Comes Next?
The latest Nifty 50 weekly analysis presents a more defined short-term setup than last week.
Last week, the key question was whether 23,070.15 support would hold. Nifty tested the area but ultimately managed to defend it, closing the week at 23,346.40.
Now, the Daily chart has formed a mother candle, giving us a fresh range to monitor.
The immediate levels are 23,592.85 on the upside and 23,118.60 on the downside.
A breakout above the mother candle could take Nifty toward the Daily 50 EMA at 23,898.94. Reclaiming that EMA would provide a stronger bullish signal, with the Weekly 50 EMA at 24,224.17 becoming the next important level.
On the other hand, a breakdown below the mother candle low would put 23,070.15 back into focus. If that support also breaks, the next major area visible on the Weekly chart is 22,185–21,733.
So, rather than trying to predict the next move, this week’s Nifty 50 weekly analysis gives us a clear framework: watch the mother candle, watch 23,070, and watch the Daily 50 EMA. The eventual break from these levels should provide more information about Nifty’s next move.
FAQs
What is the Nifty 50 weekly analysis for next week?
The current Nifty 50 weekly analysis focuses on the newly formed Daily mother candle. Its approximate range is 23,118.60–23,592.85, while 23,070.15 remains the important support below the candle.
What is the Nifty 50 mother candle?
A Daily mother candle is a relatively wide-range candle that can provide a reference range for subsequent price action. In the current setup, Nifty’s mother candle range is approximately 23,118.60–23,592.85, making both boundaries important levels to monitor.
What happens if Nifty breaks the mother candle low?
A break below approximately 23,118.60 would be an initial sign of weakness. If Nifty then also breaks 23,070.15, the next major Weekly support area could come into focus around 22,185–21,733.
What happens if Nifty breaks the mother candle high?
A sustained move above approximately 23,592.85 would indicate an upside breakout from the Daily mother candle. The next important hurdle would be the Daily 50 EMA around 23,898.94.
What is the Nifty 50 50-day EMA?
The Daily 50 EMA is currently around 23,898.94. Nifty remains below this level, making it an important resistance and recovery level for the short-term structure.
What is the Nifty 50 50-week EMA?
The Weekly 50 EMA is currently around 24,224.17. A sustained reclaim of this level would represent a stronger recovery on the Weekly timeframe.
What is the immediate support for Nifty 50?
The immediate major support remains 23,070.15, which was highlighted in last week’s analysis and successfully held during the week.
What is the next major support if 23,070 breaks?
The Weekly chart shows a strong support area between approximately 22,185 and 21,733. The Monthly 50 EMA around 22,082.34 also sits close to this broader support region.
Is the Nifty 50 trend bullish or bearish?
The current charts show Nifty trading below both the Daily and Weekly 50 EMAs, while the index has also experienced six consecutive weekly declines. At the same time, the immediate 23,070 support has held, so the next directional signal will depend significantly on how price resolves the Daily mother candle.
What should traders watch on the Nifty 50 Daily chart?
The most important levels are the Daily mother candle high around 23,592.85, the mother candle low around 23,118.60, the 23,070.15 support and the Daily 50 EMA at 23,898.94.
Disclaimer
Disclaimer: This Nifty 50 analysis is for educational and informational purposes only. It is based on technical charts, price action, moving averages, support/resistance levels and other market observations available at the time of writing. Technical analysis does not guarantee future price movements, and markets can move unpredictably due to economic data, global events, news, institutional flows and other factors. This article should not be considered investment advice or a recommendation to buy, sell or hold any security. Readers should conduct their own research, consider their risk tolerance and investment objectives, and consult a SEBI-registered financial advisor before making any investment or trading decisions.