

Nifty 50 Weekly Analysis: 25th Oct 2026 | Key Levels
The latest Nifty 50 weekly analysis brings us back to the support levels that have shaped our outlook over the past few weeks. In our previous analysis, we highlighted the Daily 50 EMA as the next resistance after Nifty’s recovery from major support. Price reacted almost exactly as anticipated: it approached the Daily 50 EMA, faced selling pressure and moved lower again.
However, the decline has not yet invalidated the broader support setup. On the Daily chart, Nifty found support near the high of the large red candle associated with the earlier Bullish Harami setup, around the 22,600 region. On the Weekly chart, the 200 EMA remains an important support reference, while the Morning Star formation discussed last week is still intact according to our marked pattern low.
The latest chart shows Nifty at 22,600, with the Weekly 200 EMA near 22,391.34, the Daily 50 EMA at 23,229.37, and the Monthly 50 EMA at approximately 22,075.29. These levels provide a clear framework for the coming week.
The key question is whether Nifty can reclaim the Daily 50 EMA and build fresh bullish momentum, or whether a break below the recent low will trigger another round of selling. Although the higher timeframes still have important support levels, a breakdown would warrant caution rather than an assumption that support will automatically hold.
Last Week’s Nifty 50 Analysis vs What Actually Happened
In our previous Nifty 50 weekly analysis, we discussed how the potential Morning Star on the Weekly chart could support a recovery, while the Daily 50 EMA was likely to be the next hurdle. We also highlighted the importance of the Weekly 200 EMA and the Monthly 50 EMA as higher-timeframe support references.
The market’s reaction to the Daily 50 EMA followed the scenario we had identified. Nifty recovered toward the moving average, but the level acted as resistance and the index moved lower again. This reinforced our earlier observation that a bounce from support does not automatically mean the short-term downtrend has ended.
There was, however, another important development. As Nifty declined, it found support around the high of the large red candle associated with the earlier Bullish Harami setup, near 22,600. This is worth monitoring because price is reacting at a previously identified reference rather than breaking straight through the entire support structure.
The Weekly chart also behaved in line with our previous analysis: the 200 EMA remains an important support area. The Morning Star pattern has not yet been invalidated because its marked low around 22,179.90 has not been broken on the latest chart. However, the pattern has not received the kind of sustained bullish follow-through that would strengthen confidence in a larger reversal.
For the coming week, the focus shifts back to two immediate questions: Can Nifty reclaim the Daily 50 EMA, and can it protect the low of the Weekly Morning Star? The answers should help clarify whether the current weakness is a temporary pullback or the beginning of another leg lower.
Monthly Analysis: The Mother Candle Range and 50 EMA Remain Crucial
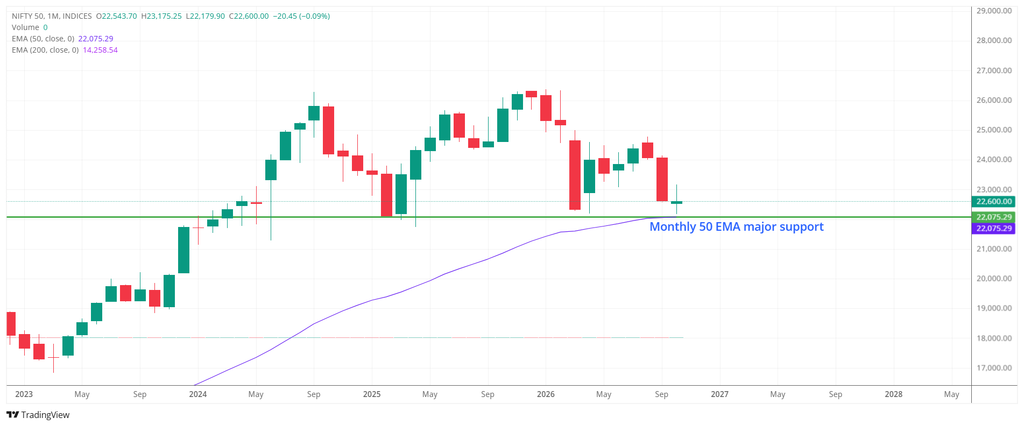
The Monthly chart continues to show Nifty trading within the large red Monthly mother candle range that we have been discussing for several months. Despite the recovery attempts and subsequent pullbacks, the broader structure has not yet produced a decisive resolution of this range.
The most important nearby reference on this timeframe is the Monthly 50 EMA at approximately 22,075.29. Nifty’s recent low of 22,179.90 came close to this moving average, and the index subsequently recovered. This keeps the Monthly 50 EMA in focus as a major higher-timeframe support reference.
The distinction between support and confirmation is important here. A reaction near the Monthly 50 EMA suggests that buyers may be defending the region, but it does not guarantee that the level will continue to hold. If selling pressure increases and Nifty breaks below the recent low, the market could revisit this support area and test it more directly.
The Monthly mother candle range remains the broader framework for understanding the market. Until price establishes a sustained breakout above the range or a decisive breakdown below its lower boundary, short-term moves should be assessed within this larger structure. A bounce within the mother candle range is not, by itself, proof of a long-term bullish reversal.
For the coming week, the Monthly chart gives us a clear priority: monitor the 50-month EMA near 22,075.29 and watch how price behaves around the recent low. If the Daily and Weekly support levels fail, this higher-timeframe reference becomes particularly important.
Weekly Analysis: The Morning Star Is Still in Play
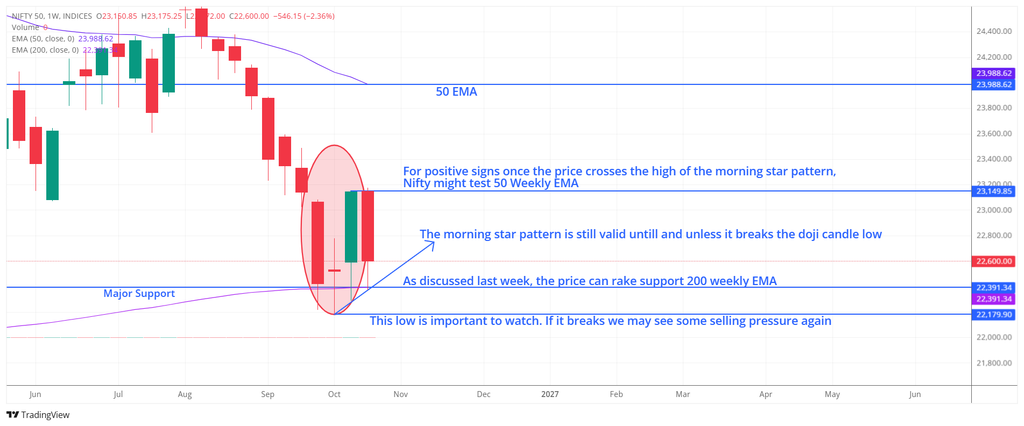
The Weekly chart is central to this week’s Nifty 50 outlook. Last week, we identified the 200-week EMA as an important support level and noted the formation of a potential Morning Star pattern around it. The latest price action shows that the recovery has struggled to gain follow-through, but the pattern’s marked low remains intact.
What Is a Morning Star Candlestick Pattern?
A Morning Star is a three-candle pattern that can appear after a decline. It typically consists of a large bearish candle, a smaller candle signalling indecision, and a strong bullish candle that moves back into the first candle’s range. The formation can indicate that selling pressure is easing and buyers are beginning to regain control.
In our chart, the low of the middle candle—the small candle within the marked formation—is approximately 22,179.90. This is the key level to monitor. As long as price does not break below this low, the potential Morning Star remains intact under our current chart interpretation. A decisive break below it would weaken the pattern and could bring renewed selling pressure.
The other important level is the high of the Morning Star formation, marked near 23,149.85. A sustained move above this level would provide a more constructive signal and could open the way for Nifty to test the Weekly 50 EMA near 23,988.62. That would represent a meaningful improvement, although the moving average would remain a hurdle rather than an assured target.
Meanwhile, the Weekly 200 EMA is around 22,391.34 and remains a key support reference. The current price is above this moving average, but the recent pullback means buyers need to continue defending the region. If Nifty breaks below the Morning Star low, the bullish interpretation would weaken even if the market attempts to find support at another level.
For next week, we need to watch both ends of the pattern. A break above the pattern high could strengthen the recovery, while a break below its low would undermine the setup. Until either occurs, the market may continue to consolidate around this important support region.
Daily Analysis: Can Nifty Reclaim the 50 EMA?
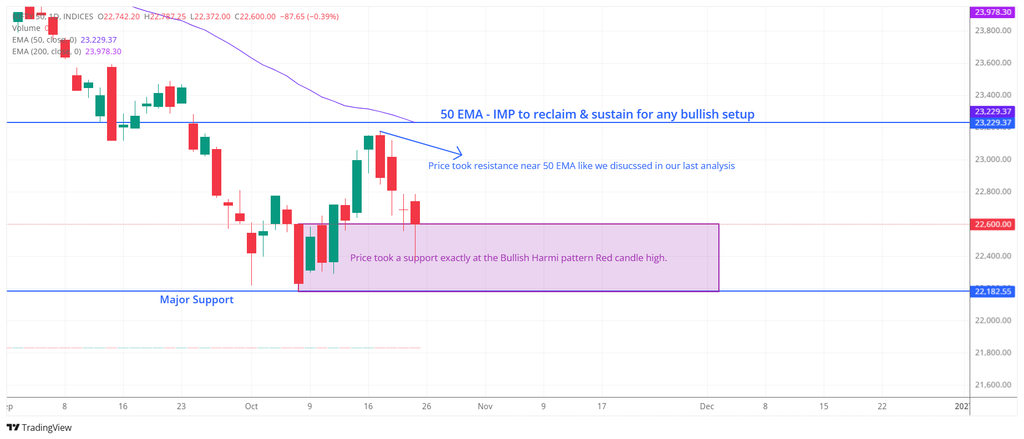
The Daily chart shows why we need to remain cautious despite the earlier bullish reaction from support. Last week, we highlighted the Daily 50 EMA as the next major hurdle. Nifty approached that moving average, encountered resistance and subsequently declined.
The latest chart places the Daily 50 EMA at approximately 23,229.37. Price is now around 22,600, meaning the index must recover and move back above the moving average before the short-term structure can improve meaningfully.
A sustained reclaim of the Daily 50 EMA would be an important positive signal. It would suggest that buyers are regaining ground after the recent rejection and could help Nifty build momentum toward the higher resistance area near 23,978–23,988, where the Daily 200 EMA and Weekly 50 EMA are positioned.
However, another rejection at the Daily 50 EMA would indicate that selling pressure remains active. In that case, the market could continue to consolidate or retest the lower support region.
The immediate support on the Daily chart is also worth watching. Nifty has reacted around the high of the large red candle associated with the earlier Bullish Harami setup, near 22,600. This level has become an important short-term reference. Below it, the previously marked major support at 22,182.55 remains relevant.
If Nifty breaks below the recent low around 22,179.90, it could trigger another bout of selling. Although the Weekly 200 EMA and Monthly 50 EMA remain nearby support references, traders should not assume that these levels will prevent further downside.
The Daily chart therefore presents a straightforward test for next week: reclaim and sustain above the 50 EMA, or risk another move toward the recent low.
Key Nifty 50 Support and Resistance Levels to Watch
The following levels are based on the latest chart annotations and should be interpreted according to their respective timeframes.
| Level | Timeframe | Significance |
|---|---|---|
| 23,978.30 | Daily | 200 EMA; higher recovery hurdle |
| 23,988.62 | Weekly | 50 EMA; major resistance if recovery strengthens |
| 23,229.37 | Daily | 50 EMA; immediate resistance |
| 23,149.85 | Weekly | Marked high of the Morning Star formation |
| 22,600.00 | Daily | Recent price reference and support near the earlier Bullish Harami candle high |
| 22,391.34 | Weekly | 200 EMA; important support |
| 22,182.55 | Daily / Weekly | Previously marked major support |
| 22,179.90 | Weekly | Low of the marked Morning Star formation; critical pattern level |
| 22,075.29 | Monthly | 50 EMA; major higher-timeframe support |
The most important upside level is the Daily 50 EMA at 23,229.37. A sustained move above it would improve the immediate picture, while a move above the Weekly Morning Star high near 23,149.85 would provide a positive signal from the pattern itself.
On the downside, the Morning Star low at 22,179.90 and the previously marked support at 22,182.55 are practically adjacent on the chart. A decisive break below this region would weaken the support setup. The Weekly 200 EMA near 22,391.34 and the Monthly 50 EMA near 22,075.29 remain important references as price action develops.
Bull Case: Nifty Reclaims the Daily 50 EMA
The bullish scenario begins with Nifty holding the current support region and moving back above the Daily 50 EMA at 23,229.37. A sustained reclaim would indicate that the recent rejection is losing influence and buyers are starting to regain control.
The Weekly Morning Star also needs to show stronger follow-through. A move above its marked high near 23,149.85 would be a positive signal, while continued defence of the pattern low near 22,179.90 would preserve its bullish interpretation.
If these developments occur together, Nifty could move toward the Weekly 50 EMA at 23,988.62 and the Daily 200 EMA at 23,978.30. These moving averages form a higher resistance area around 23,978–23,989. Reaching this region would require sustained buying pressure, so it should be treated as a subsequent hurdle rather than an immediate expectation.
The bullish case therefore depends on three developments: the lower support remains intact, the Morning Star receives stronger confirmation, and Nifty reclaims the Daily 50 EMA.
Bear Case: The Recent Low Breaks
The bearish scenario would strengthen if Nifty continues to face resistance near the Daily 50 EMA and breaks below the recent low around 22,179.90. This would invalidate the marked Morning Star setup under our current interpretation and could trigger another round of selling.
A breakdown below this region would also put the previously marked support at 22,182.55 under pressure. The Weekly 200 EMA near 22,391.34 and the Monthly 50 EMA near 22,075.29 remain important higher-timeframe references, but their presence does not guarantee that price will hold.
The Monthly 50 EMA is especially important because it lies close to the recent low. If the index breaks below the lower support region and continues weakening, this moving average would become a key level to monitor. A sustained breakdown through the broader support cluster would materially weaken the current technical setup.
The bearish case is therefore not simply about a failed recovery at the Daily 50 EMA. It is about whether the failure eventually leads to a decisive breakdown below the recent low and the support structure that has been holding Nifty.
What Should Traders Watch Next Week?
The coming week should be approached through a small number of clearly defined levels rather than a fixed prediction.
- Daily 50 EMA — 23,229.37: Watch whether Nifty can reclaim and sustain above this moving average. This is the immediate test for the recovery.
- Morning Star high — 23,149.85: A sustained move above the marked pattern high would strengthen the bullish interpretation of the Weekly setup.
- Recent support — 22,600: Watch whether price continues to hold around the high of the large red candle associated with the earlier Bullish Harami.
- Morning Star low — 22,179.90: A decisive break below this level would invalidate the current bullish pattern interpretation.
- Weekly 200 EMA — 22,391.34: This remains an important support reference and should be monitored alongside the marked pattern low.
- Monthly 50 EMA — 22,075.29: If the lower support region fails, this becomes a key higher-timeframe level to watch.
- 23,978–23,989: If the recovery strengthens and Nifty reclaims the Daily 50 EMA, this becomes the next major moving-average resistance area.
The immediate priority is the Daily 50 EMA, while the Weekly Morning Star low and the Monthly 50 EMA define important downside references. Price action around these levels should help determine whether the index is stabilising or preparing for another move lower.
Investor Takeaway: Support Is Still the Deciding Factor
This week’s Nifty 50 analysis shows that the market has struggled to extend its earlier recovery. The Daily 50 EMA acted as resistance as expected, and price has moved back toward the support region near 22,600. At the same time, the Weekly 200 EMA remains important, and the Morning Star pattern has not yet been invalidated.
The Monthly chart continues to show Nifty 50 trading inside the large red mother candle range, with the 50-month EMA near 22,075.29 providing a major higher-timeframe support reference.
The coming week will be about whether Nifty 50 can reclaim the Daily 50 EMA at 23,229.37 or whether the recent low near 22,179.90 breaks. A sustained move above resistance would improve the recovery setup. A decisive breakdown below the pattern low would weaken it and could trigger further selling, even though higher-timeframe support levels remain nearby.
For now, we will continue to let price action guide the outlook. The levels are clear; the next move depends on how Nifty 50 reacts around them.
Frequently Asked Questions
What is the key resistance for Nifty 50 next week?
The Daily 50 EMA at approximately 23,229.37 is the immediate resistance to watch. A sustained move above it would improve the short-term technical picture.
What is the Weekly 200 EMA level for Nifty 50?
The latest chart places the Weekly 200 EMA at approximately 22,391.34. It remains an important support reference.
Is the Weekly Morning Star pattern in Nifty 50 still valid?
The marked Morning Star in Nifty 50 remains intact under our current chart interpretation because its low near 22,179.90 has not been broken. A decisive move below that low would weaken or invalidate the bullish pattern setup.
What happens if Nifty 50 breaks above the Morning Star high?
A sustained move above the marked high near 23,149.85 would provide a more constructive signal. If the recovery continues, the Weekly 50 EMA near 23,988.62 and Daily 200 EMA near 23,978.30 become important resistance references.
What happens if Nifty 50 breaks below 22,179.90?
A decisive break below 22,179.90 would invalidate the current Morning Star interpretation and could trigger further selling. The Monthly 50 EMA near 22,075.29 would become an important higher-timeframe reference.
What is the Monthly 50 EMA for Nifty 50?
The latest chart shows the Monthly 50 EMA at approximately 22,075.29. It remains a major support reference if the lower support region fails.
Can the Daily 50 EMA act as resistance for Nifty 50 again?
Yes. Nifty 50 previously approached the Daily 50 EMA and moved lower. Until the index reclaims and sustains above approximately 23,229.37, this moving average remains an important resistance level to monitor.
Is Nifty 50 bullish or bearish right now?
The short-term recovery has weakened after the rejection at the Daily 50 EMA. However, the Weekly Morning Star remains intact under our current interpretation, and higher-timeframe support references are nearby. The outlook depends on whether price reclaims resistance or breaks below the recent low.
What should traders watch in Nifty 50 next week?
The main levels are the Daily 50 EMA at 23,229.37, the Morning Star high near 23,149.85, the recent low at 22,179.90, the Weekly 200 EMA at 22,391.34 and the Monthly 50 EMA at 22,075.29. Price action around these levels should help clarify the next directional move.
Disclaimer
Disclaimer: This Nifty 50 analysis is for educational and informational purposes only. It is based on technical charts, price action, moving averages, support/resistance levels and other market observations available at the time of writing. Technical analysis does not guarantee future price movements, and markets can move unpredictably due to economic data, global events, news, institutional flows and other factors. This article should not be considered investment advice or a recommendation to buy, sell or hold any security. Readers should conduct their own research, consider their risk tolerance and investment objectives, and consult a SEBI-registered financial advisor before making any investment or trading decisions.