

Nifty 50 Analysis: Bulls Defend the Trendline, But a Bigger Test Awaits
What Happened This Week?
The Nifty 50 ended the week around 24,175.65, continuing to consolidate after its recent recovery from the April lows. While the broader structure has improved from the sharp correction seen earlier in the year, the index is now approaching an important technical decision point.
The latest charts show Nifty trading around its daily 50 EMA at 24,192.20, but still below the daily 200 EMA at 24,383.36 and the weekly 50 EMA at 24,344.89. This creates an interesting setup where the index has managed to hold short-term support, but has not yet reclaimed the moving averages that could confirm stronger bullish momentum.
At the same time, the rising trendline originating from the April low continues to support the recovery. However, this trendline has been tested several times already, making the next test increasingly important. If support holds, bulls could get another opportunity to push higher. If it breaks, the next downside zone around 23,823.60–23,891.55 could come into focus.
Check-out our previous Nifty 50 weekly analysis here.
Monthly Chart: Nifty Remains Inside the Mother-Candle Range
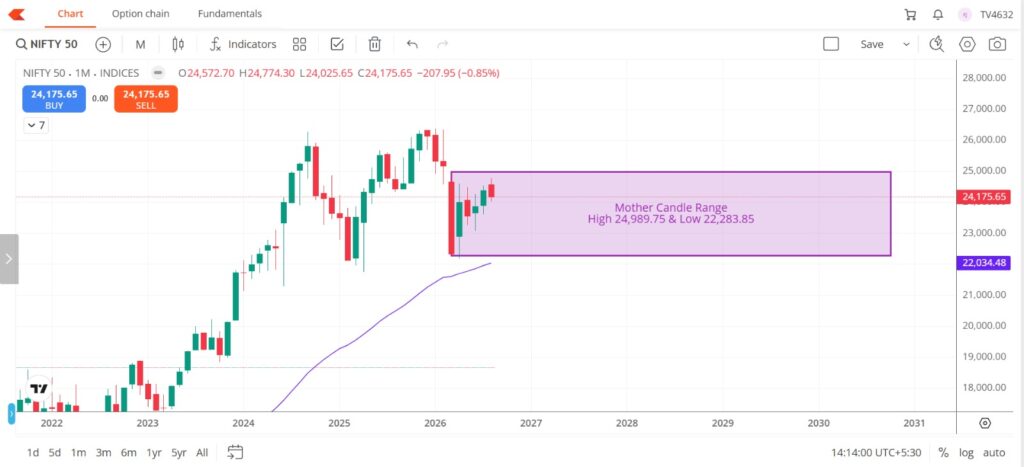
The monthly chart continues to provide the broader framework for the Nifty 50. The index remains within the monthly mother-candle range, which extends from 22,283.85 to 24,989.75.
With Nifty currently around 24,175.65, the index remains comfortably inside this broader range. The market has recovered significantly from the lower end of the range but has not yet challenged its upper boundary decisively.
The 24,989.75 level remains the major resistance on the monthly timeframe. A sustained breakout above this level would represent a significant improvement in the longer-term structure and could potentially open the door for a fresh bullish phase.
On the other hand, the lower boundary at 22,283.85 remains the broader downside reference. It is not an immediate level based on the current setup, but a sustained deterioration in the daily and weekly structure could eventually bring the lower end of the mother-candle range back into focus.
For now, the monthly chart continues to suggest consolidation within a large range, rather than a confirmed breakout in either direction.
Weekly Chart: Nifty Faces the 50 EMA
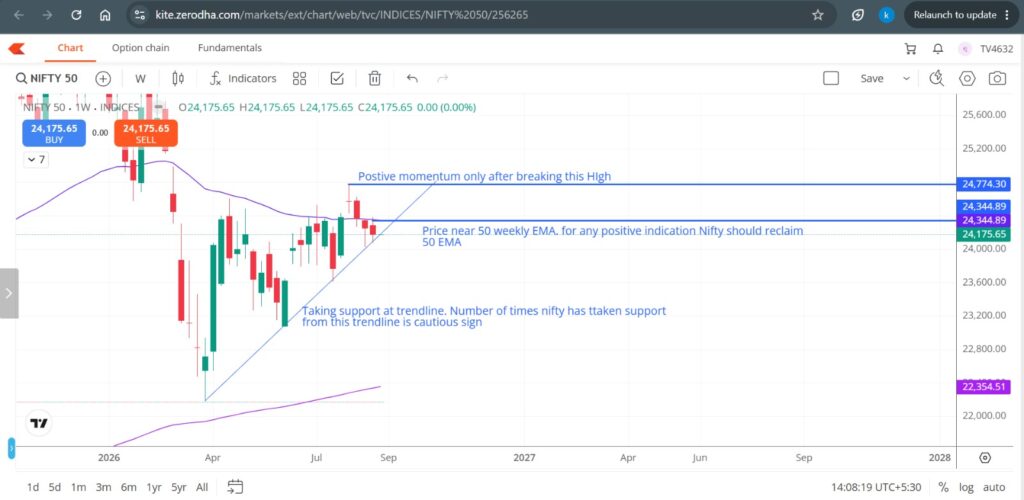
The weekly chart is currently at an important resistance zone. Nifty closed around 24,175.65, while the weekly 50 EMA is at 24,344.89.
This moving average has become an important reference because Nifty has been moving around it during the recent recovery. A decisive reclaim of the weekly 50 EMA, particularly with a strong bullish candle and follow-through, would provide a stronger indication that the recovery is gaining momentum.
For now, however, Nifty remains below the level. This means bulls still have some work to do before the weekly structure can turn convincingly bullish.
The weekly chart also shows a rising trendline originating from the April low. This trendline has been supporting the recovery and remains an important level to watch. However, there is an important caveat: the trendline has already been tested multiple times.
Repeated tests of a trendline can weaken the support over time. Therefore, while the trendline continues to hold, traders should be cautious about assuming that it will continue to provide support indefinitely. A decisive breakdown would be more significant now because the market has already interacted with this level several times.
Weekly View
The weekly setup can therefore be viewed through three important references:
- 24,344.89: Weekly 50 EMA and immediate resistance
- 24,774.30: Level above which positive momentum could strengthen
- Rising trendline: Important support, but increasingly vulnerable after repeated tests
A strong reclaim of the 50-week EMA would improve the recovery structure, while a trendline breakdown would shift the balance toward caution.
Daily Chart: Nifty Holds the 50 EMA but Remains Below the 200 EMA
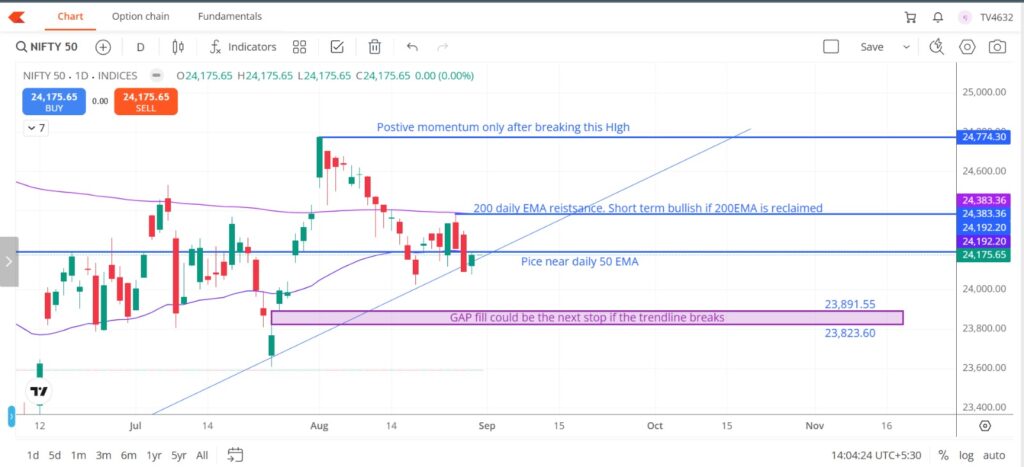
The daily chart presents a mixed picture.
Nifty is currently around 24,175.65, very close to the daily 50 EMA at 24,192.20. Holding this moving average would help preserve the short-term recovery structure, but the index is still below the daily 200 EMA at 24,383.36.
The 200-day EMA is particularly important because it often acts as a broader trend reference. The chart identifies 24,383.36 as resistance, with a sustained reclaim of this level potentially turning the short-term structure more bullish.
Therefore, the immediate challenge for bulls is not simply to move above the 50-day EMA. They need to reclaim the 200-day EMA and then demonstrate that the breakout can sustain itself.
The daily chart also continues to show the rising trendline from the April low. Nifty has been using this trendline as support during the recovery, but once again, repeated tests are worth watching closely. A trendline does not necessarily become stronger every time it holds; repeated touches can eventually weaken the level.
This makes the current setup particularly important. Nifty is effectively caught between the 50-day EMA and the rising trendline on the downside, and the 200-day EMA on the upside.
24,774.30: The Level That Could Bring Positive Momentum
The daily and weekly charts both highlight 24,774.30 as an important upside level.
The chart specifically marks this level as the point where positive momentum could return. A breakout above the recent high would indicate that buyers have managed to overcome the current resistance structure and could provide the next confirmation of the recovery.
However, it is important to distinguish between this level and the monthly resistance.
A move above 24,774.30 would be a positive development from a short- to medium-term perspective, but Nifty would still have to deal with the much larger 24,989.75 monthly mother-candle high.
The bullish progression therefore looks like:
Reclaim 24,344.89 → sustain above 24,383.36 → break 24,774.30 → challenge 24,989.75
The stronger the price action and follow-through at each stage, the more convincing the recovery becomes.
What Happens If the Trendline Breaks?
The rising trendline remains the most important dynamic support visible on the daily and weekly charts.
If Nifty continues to hold this trendline, the recovery structure remains intact. However, a decisive break would be an important warning signal, particularly because the trendline has already been tested multiple times.
The daily chart identifies a potential downside zone between 23,823.60 and 23,891.55. This area represents the next important zone to watch if the trendline breaks.
The setup would therefore become more cautious if Nifty loses the trendline and subsequently fails to reclaim it. A quick recovery back above the trendline would be different from a sustained move below it.
This distinction is important because a temporary breakdown can sometimes turn into a false breakdown, while sustained trading below the trendline would suggest that the recovery structure is losing strength.
Multi-Timeframe Nifty 50 Analysis
Looking at the three timeframes together gives us a much clearer picture.
The monthly chart remains range-bound, with Nifty trading within the 22,283.85–24,989.75 mother-candle range. The upper boundary remains the major resistance, while the lower boundary represents the broader downside reference.
The weekly chart remains below the 50 EMA at 24,344.89, meaning the recovery has not yet received a strong weekly confirmation. At the same time, the rising trendline from the April low continues to support the index. However, repeated tests of this trendline make its next reaction increasingly important.
The daily chart is sitting around the 50 EMA at 24,192.20, but remains below the 200 EMA at 24,383.36. This creates a relatively narrow battle zone between short-term support and medium-term resistance.
Taken together, the setup remains neutral to cautiously bearish in the short term, but not structurally bearish on the larger timeframe.
The market is waiting for confirmation.
Bull Case
The bullish case starts with Nifty continuing to defend the rising trendline and the 50-day EMA around 24,192.20.
If buyers manage to hold this support and push the index back above the daily 200 EMA at 24,383.36, the short-term structure would improve considerably. A strong reclaim of the weekly 50 EMA at 24,344.89 would further strengthen the recovery.
The next major hurdle would then be 24,774.30. A sustained breakout above this level could bring positive momentum back into the market and put the 24,989.75 monthly mother-candle high within striking distance.
The strongest bullish sequence would therefore be:
Trendline holds → 50-day EMA holds → 200-day/50-week EMA reclaimed → 24,774.30 breaks → 24,989.75 tested
A sustained move above the monthly mother-candle high would be a much bigger structural development and could change the broader market outlook.
Bear Case
The bearish case would begin with Nifty failing to hold the rising trendline.
The importance of this support has increased because the trendline has already been tested several times. Another test followed by a decisive breakdown could indicate that buyers are losing their grip on the recovery structure.
If this happens alongside a sustained move below the 50-day EMA at 24,192.20, the downside could gain momentum.
The next zone marked on the daily chart is 23,823.60–23,891.55. This area could become the next destination if the trendline breaks and selling pressure increases.
A sustained move below this zone would further weaken the short-term structure, although the broader monthly mother-candle range would still remain intact above 22,283.85.
What Should Traders Watch Next Week?
The coming week could be important because Nifty is approaching several closely placed technical levels.
The first thing to watch is whether the index can defend the rising trendline and 50-day EMA around 24,192.20. Holding this area would keep the recovery structure alive.
On the upside, 24,344.89 is the weekly 50 EMA, while 24,383.36 is the daily 200 EMA. A strong reclaim of this cluster would improve the short-term setup.
Above these levels, 24,774.30 remains the major momentum trigger.
Beyond that, the broader monthly resistance is at 24,989.75.
On the downside, a decisive trendline breakdown could bring 23,891.55–23,823.60 into focus.
| Level | Significance |
|---|---|
| 24,989.75 | Major monthly mother-candle resistance |
| 24,774.30 | Positive momentum trigger |
| 24,383.36 | Daily 200 EMA |
| 24,344.89 | Weekly 50 EMA |
| 24,192.20 | Daily 50 EMA |
| Rising trendline | Important dynamic support |
| 23,891.55–23,823.60 | Downside zone if trendline breaks |
| 22,283.85 | Monthly mother-candle low |
Investor Takeaway
The latest Nifty 50 weekly analysis points to a market at an important crossroads.
The broader monthly structure remains intact, with the index trading inside the 22,283.85–24,989.75 mother-candle range. On the weekly timeframe, however, Nifty remains below the 50 EMA, while the daily chart shows the index sitting around its 50 EMA and below the 200 EMA.
The rising trendline from the April low remains the most important support structure. It has successfully supported the recovery so far, but its repeated testing means traders should be increasingly cautious about another test. If the trendline breaks decisively, the 23,823.60–23,891.55 zone becomes the next important area to monitor.
For the bulls, the first objective is to reclaim the 24,344.89–24,383.36 zone, followed by a breakout above 24,774.30. A move beyond 24,989.75 would represent a much more significant bullish development on the monthly timeframe.
For now, patience remains important. The charts are giving us clearly defined levels, and the next directional move should become easier to identify once Nifty breaks out of this technical battle.
For more insights beyond market trends, explore our Personal Finance section for practical investing and money-management ideas.
Conclusion
The latest Nifty 50 setup is a classic battle between support holding underneath and multiple resistance levels overhead.
The monthly chart remains within its mother-candle range, keeping the broader structure neutral until the index breaks above 24,989.75 or moves significantly toward the lower boundary at 22,283.85.
The weekly chart shows Nifty below the 50 EMA at 24,344.89, while the rising trendline from the April low continues to support the recovery. However, repeated tests of the trendline mean its support should not be taken for granted.
The daily chart is equally important. Nifty is currently around the 50-day EMA at 24,192.20, but remains below the 200-day EMA at 24,383.36. This leaves the index caught between short-term support and medium-term resistance.
The immediate bullish trigger remains 24,774.30, while 24,989.75 is the bigger monthly hurdle. On the downside, a decisive break of the rising trendline could bring the 23,823.60–23,891.55 zone into focus.
For the coming week, the message from all three timeframes is clear: watch the trendline on the downside and the 24,344–24,383 resistance cluster on the upside. The next decisive move through these levels could provide a much clearer signal about Nifty’s direction.
Frequently Asked Questions (FAQs)
1. What is the current Nifty 50 level?
The Nifty 50 is currently around 24,175.65, based on the latest chart used for this analysis. The index is trading close to its daily 50 EMA while remaining below the weekly 50 EMA and daily 200 EMA.
2. What is the major resistance for Nifty 50?
The major resistance on the monthly timeframe is 24,989.75, which is the high of the monthly mother-candle range. A sustained breakout above this level would be a significant bullish development for the broader structure.
3. Why is 24,774.30 important for Nifty 50?
24,774.30 is the recent high marked on the daily and weekly charts. A sustained breakout above this level could bring positive momentum back into the Nifty 50 and strengthen the ongoing recovery.
4. What is the Nifty 50 50-week EMA?
The 50-week EMA is currently at 24,344.89. Nifty is trading below this level. Reclaiming the weekly 50 EMA with a strong bullish candle would provide a more positive indication for the recovery structure.
5. What is the Nifty 50 50-day EMA?
The 50-day EMA is at 24,192.20. Nifty is currently trading close to this level, making it an important short-term support reference.
6. What is the Nifty 50 200-day EMA?
The 200-day EMA is at 24,383.36. This is an important resistance level on the daily chart. A sustained reclaim of the 200-day EMA could strengthen the short-term bullish setup.
7. Is the Nifty 50 trendline still supporting the index?
Yes. The rising trendline originating from the April low continues to support the recovery. However, the trendline has been tested multiple times, and repeated tests can weaken support. Therefore, another test of the trendline should be monitored carefully.
8. What happens if Nifty 50 breaks the rising trendline?
A decisive break below the rising trendline could weaken the current recovery structure. The next important downside zone marked on the daily chart is 23,823.60–23,891.55.
9. What is the monthly mother-candle range for Nifty 50?
The monthly mother-candle range extends from 22,283.85 to 24,989.75. Nifty remains inside this broader range, meaning the monthly chart has not yet confirmed a decisive breakout.
10. What is the bullish scenario for Nifty 50?
The bullish scenario would involve Nifty holding the rising trendline and the 50-day EMA, followed by a reclaim of the 24,344.89–24,383.36 zone. A subsequent breakout above 24,774.30 could strengthen positive momentum and bring the monthly resistance at 24,989.75 into focus.
11. What is the bearish scenario for Nifty 50?
The bearish scenario would develop if Nifty decisively breaks the rising trendline and loses the 50-day EMA at 24,192.20. In that case, the 23,823.60–23,891.55 zone could become the next important area to watch.
12. Is the Nifty 50 trend currently bullish or bearish?
The multi-timeframe setup is neutral to cautiously bearish in the short term, while the broader monthly structure remains range-bound rather than decisively bearish. The index needs to reclaim the weekly 50 EMA and overcome the higher resistance levels for the bullish structure to strengthen.
13. What are the key Nifty 50 levels to watch next week?
The major levels are:
- 24,989.75: Monthly mother-candle resistance
- 24,774.30: Positive momentum trigger
- 24,383.36: Daily 200 EMA
- 24,344.89: Weekly 50 EMA
- 24,192.20: Daily 50 EMA
- 23,891.55–23,823.60: Downside zone if the trendline breaks
- 22,283.85: Monthly mother-candle low
14. Can repeated tests of a trendline weaken its support?
Yes. Repeated tests can make a trendline increasingly vulnerable. While the rising trendline has supported the Nifty 50 recovery several times, traders should not assume that it will continue to hold indefinitely. A decisive breakdown would therefore carry greater significance.
15. What should traders watch in the next Nifty 50 weekly session?
Traders should watch whether Nifty can hold the rising trendline and 24,192.20, reclaim the 24,344.89–24,383.36 resistance zone and eventually break 24,774.30. On the downside, a decisive trendline breakdown could shift attention toward 23,891.55–23,823.60.
Looking to sharpen your technical analysis skills? Explore these recommended books and learning resources for understanding charts, indicators, and market trends.
Top Rates Books on Amazon:
Technical Analysis Made Easy: A Beginner to Advanced Guide to Price Action Trading
Technical Analysis of the Financial Markets
Disclaimer
Disclaimer: This Nifty 50 analysis is intended for educational and informational purposes only and should not be considered investment, trading, or financial advice. The technical levels, chart patterns, support and resistance zones, and market scenarios discussed are based on technical analysis and may change as market conditions evolve. Investors and traders should conduct their own research, assess their risk tolerance, and consult a qualified financial advisor before making any investment or trading decisions. StockMarketMasala does not guarantee the accuracy or future outcome of any market view or price level discussed in this article.